Push WireGuard Logs to Datadog SIEM
This article will show you how to connect all the events Pro Custodibus generates about WireGuard usage, changes, and security alerts over to Datadog — and how to integrate it with Datadog’s Cloud SIEM (Security Information and Event Management) functionality.
Pro Custodibus can push events to Datadog through Pro Custodibus’ webhooks. Pro Custodibus sends events to Datadog’s Log Collection endpoints via Datadog’s generic Send Logs HTTP intake API. You must set up a Datadog API Key to receive these events.
Pro Custodibus can push the following types of events to Datadog:
Datadog API Key
But first, before you set up the integration between Pro Custodibus and Datadog, create a Datadog API key for Pro Custodibus to use. While you will probably have other Datadog API keys already created, setting up a separate one just for Pro Custodibus will allow you to rotate or revoke it independently of your other Datadog integrations.
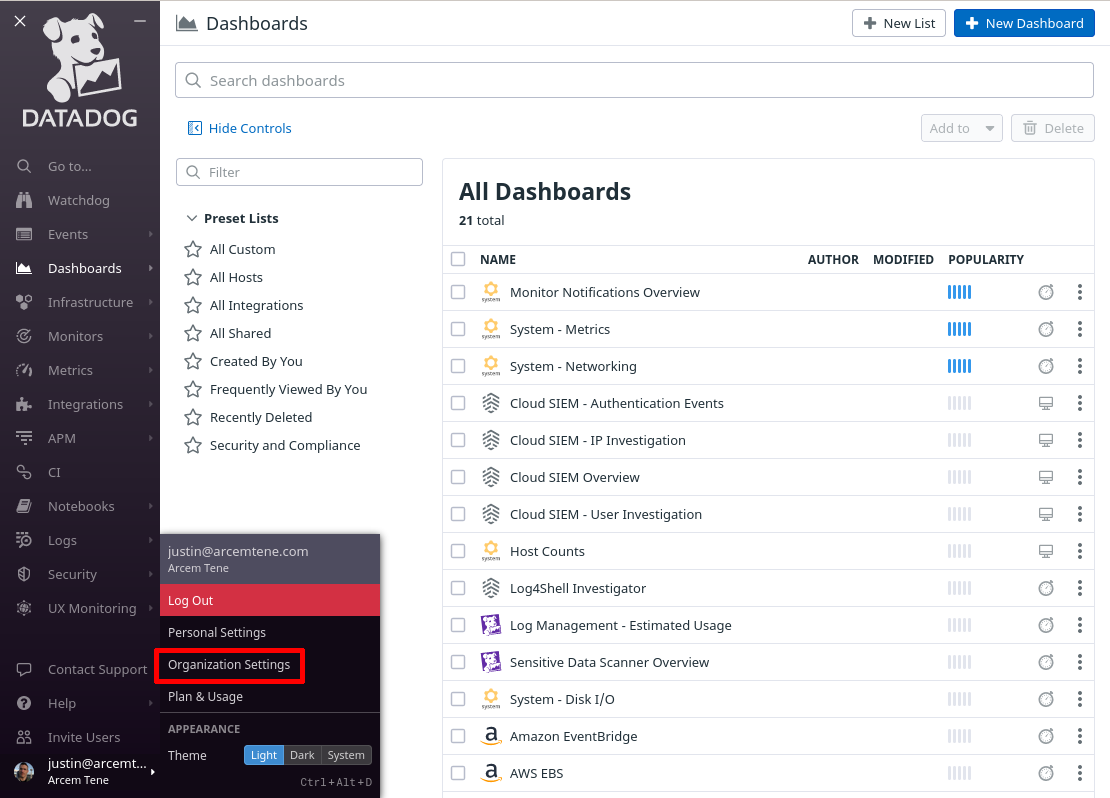
To create a Datadog API key, log into the Datadog app, and navigate to the Organization Settings area of the app:
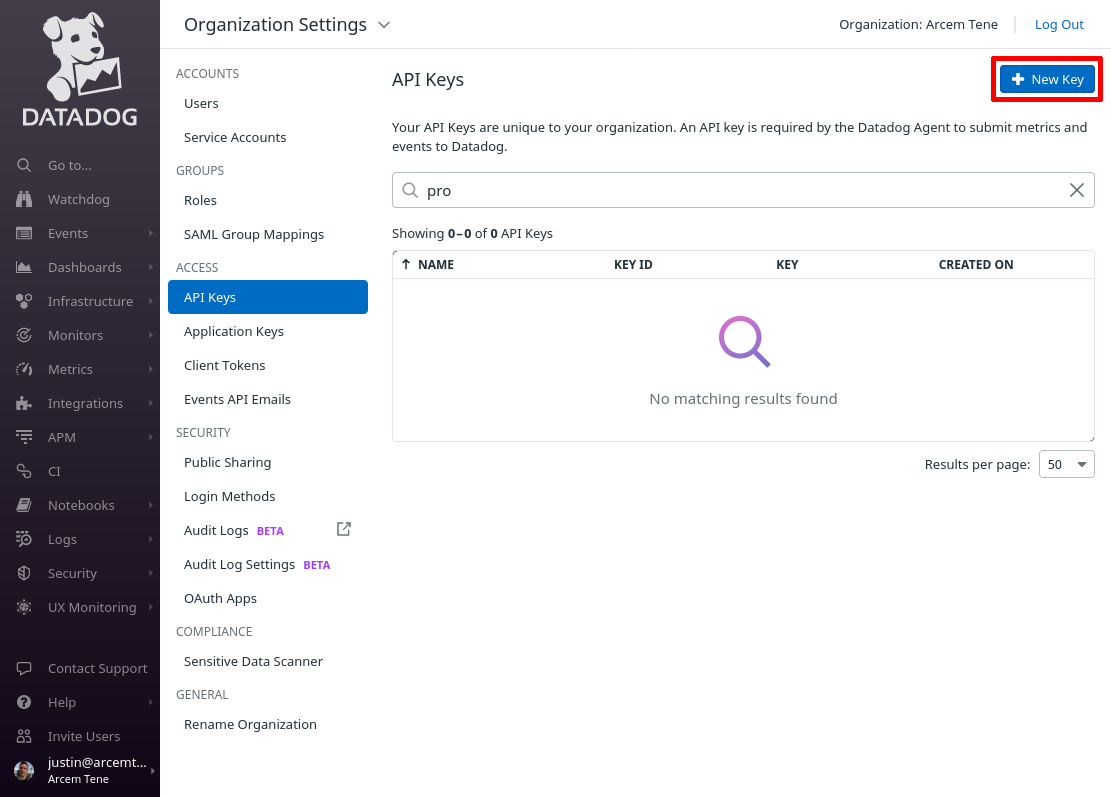
Then click on the API Keys section; and on the API Keys page, click the New Key button:
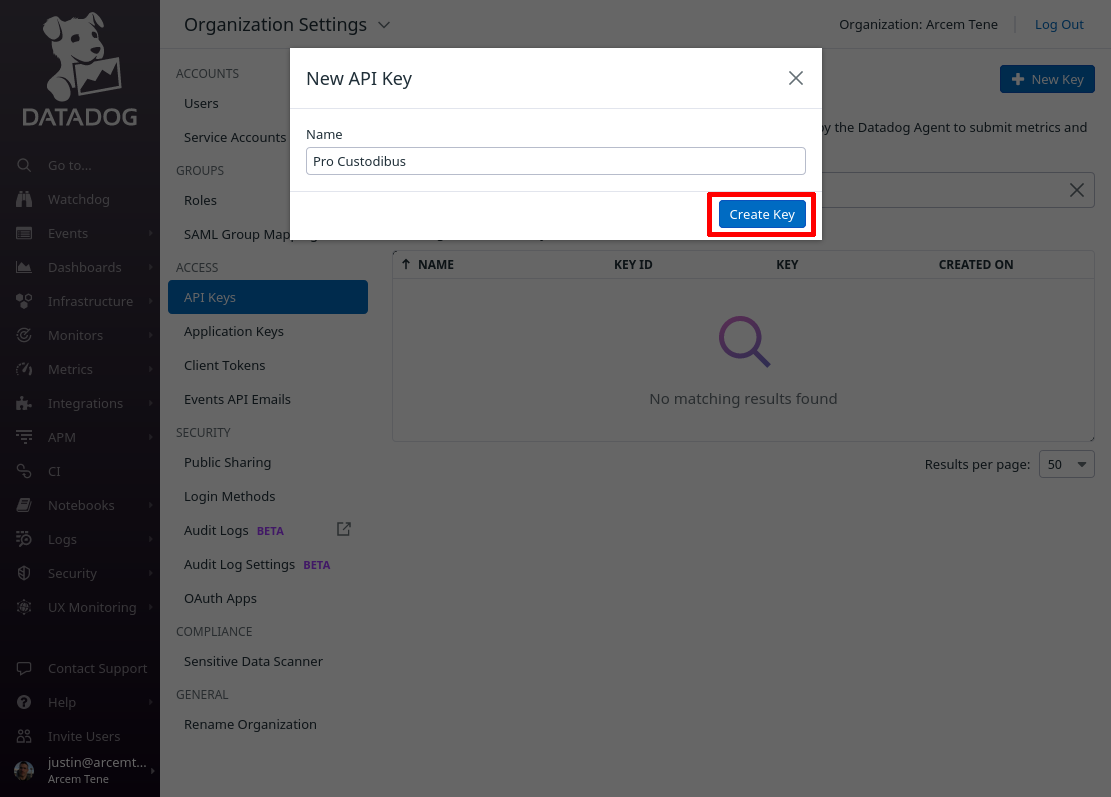
Enter a useful display name for the key (like “Pro Custodibus”), and then click the Create Key button:
Copy the new API key, as we will use it later on to configure Pro Custodibus:
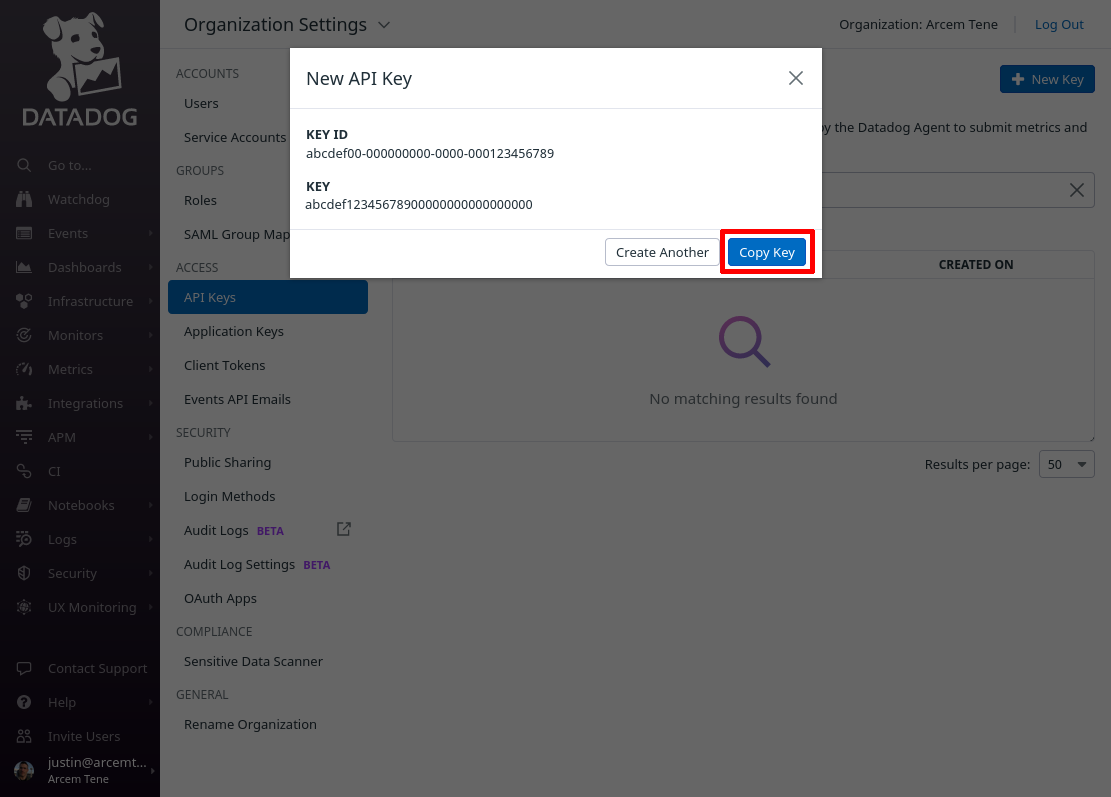
In the following sections, we will use abcdef12345678900000000000000000 as our example Datadog API key.
Alerts
Pro Custodibus generates alerts to notify you about suspicious usage of your monitored WireGuard interfaces, such as potential indicators of WireGuard key compromise. Instead of (or in addition to) sending you emails or SMS messages, you can configure Pro Custodibus to send these alerts to Datadog.
Follow these steps to connect Pro Custodibus’ alerts to Datadog:
Set Up Pro Custodibus Webhooks for Alerts
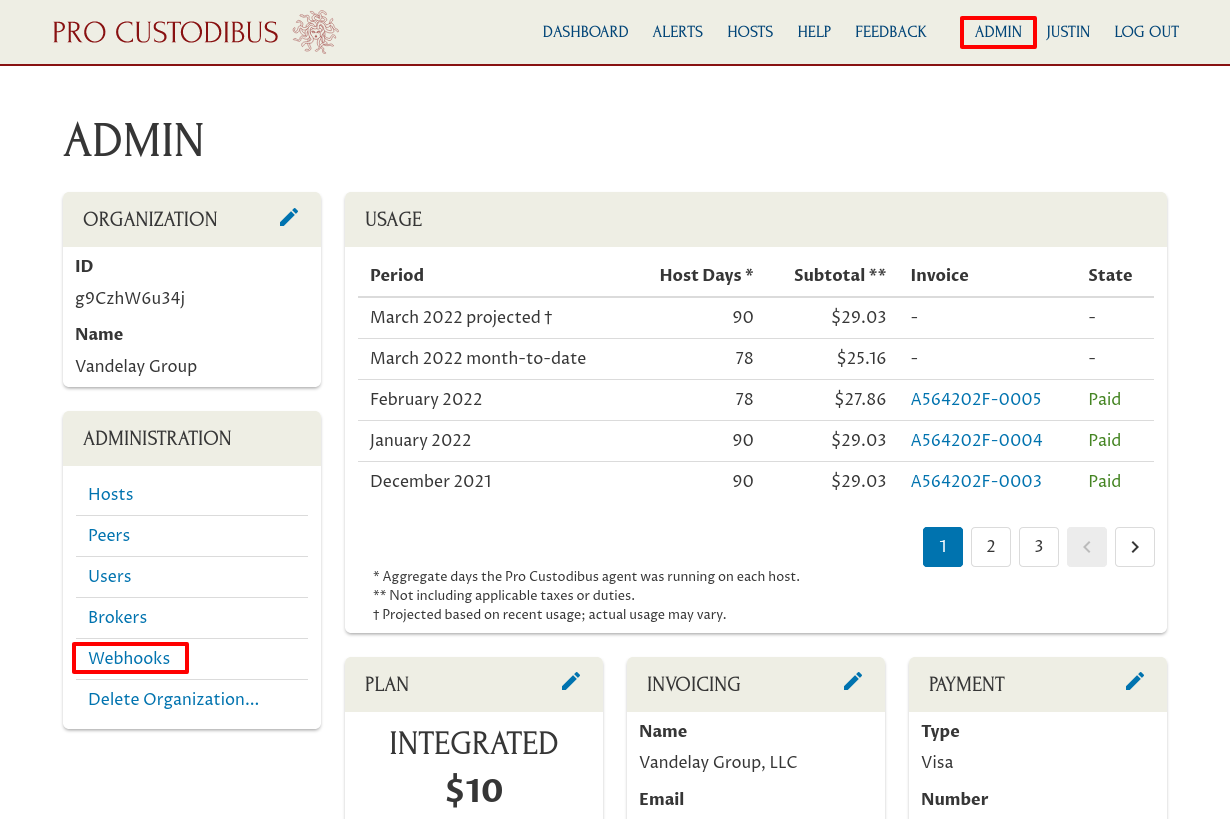
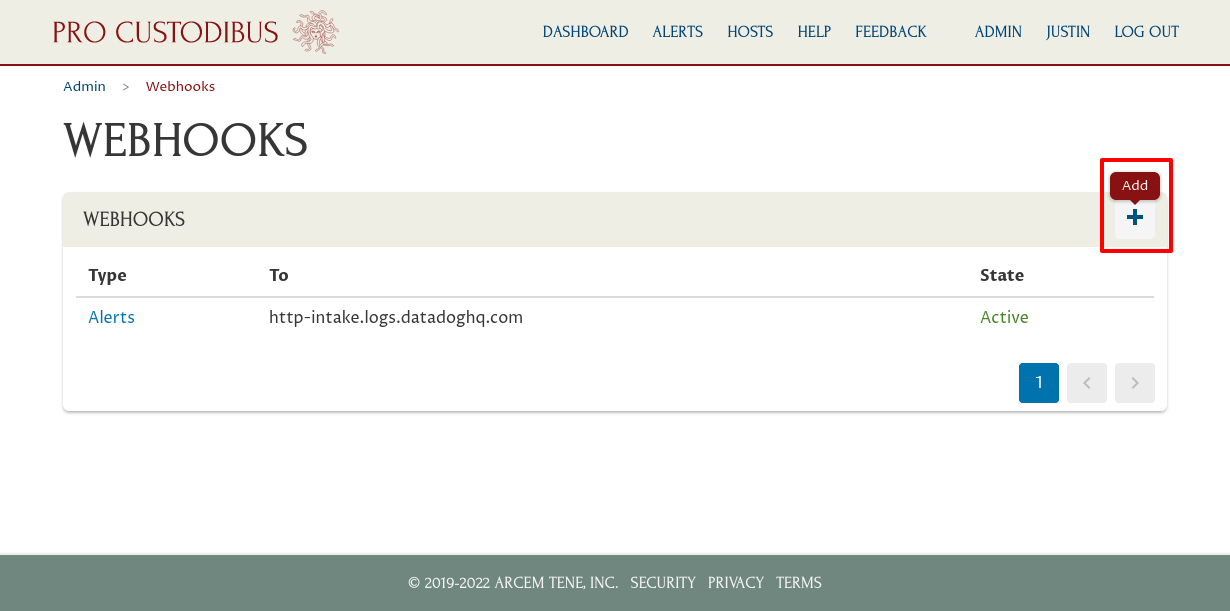
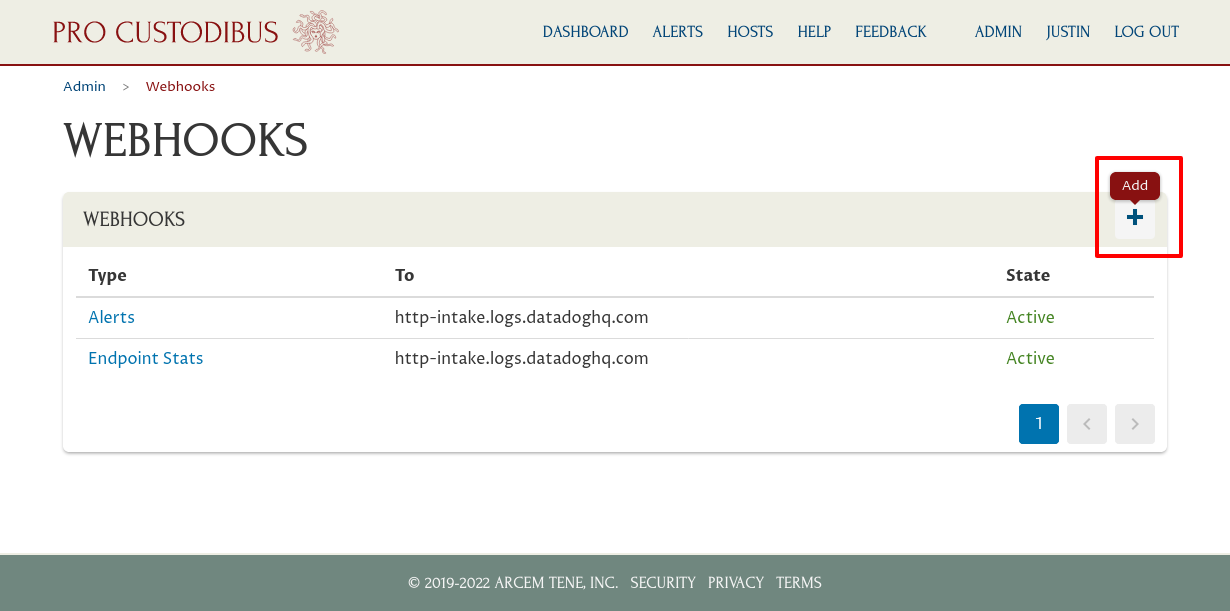
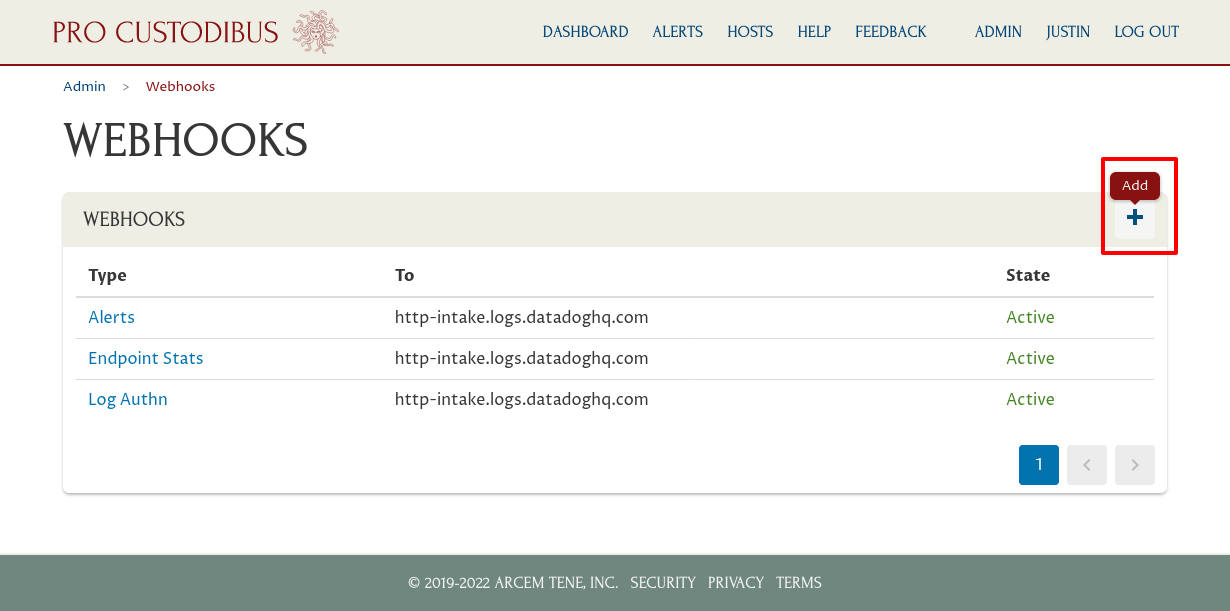
To set up the Pro Custodibus webhook that will push alerts to Datadog, log into the Pro Custodibus app, and navigate to the Admin area of the app; then click the Webhooks link:
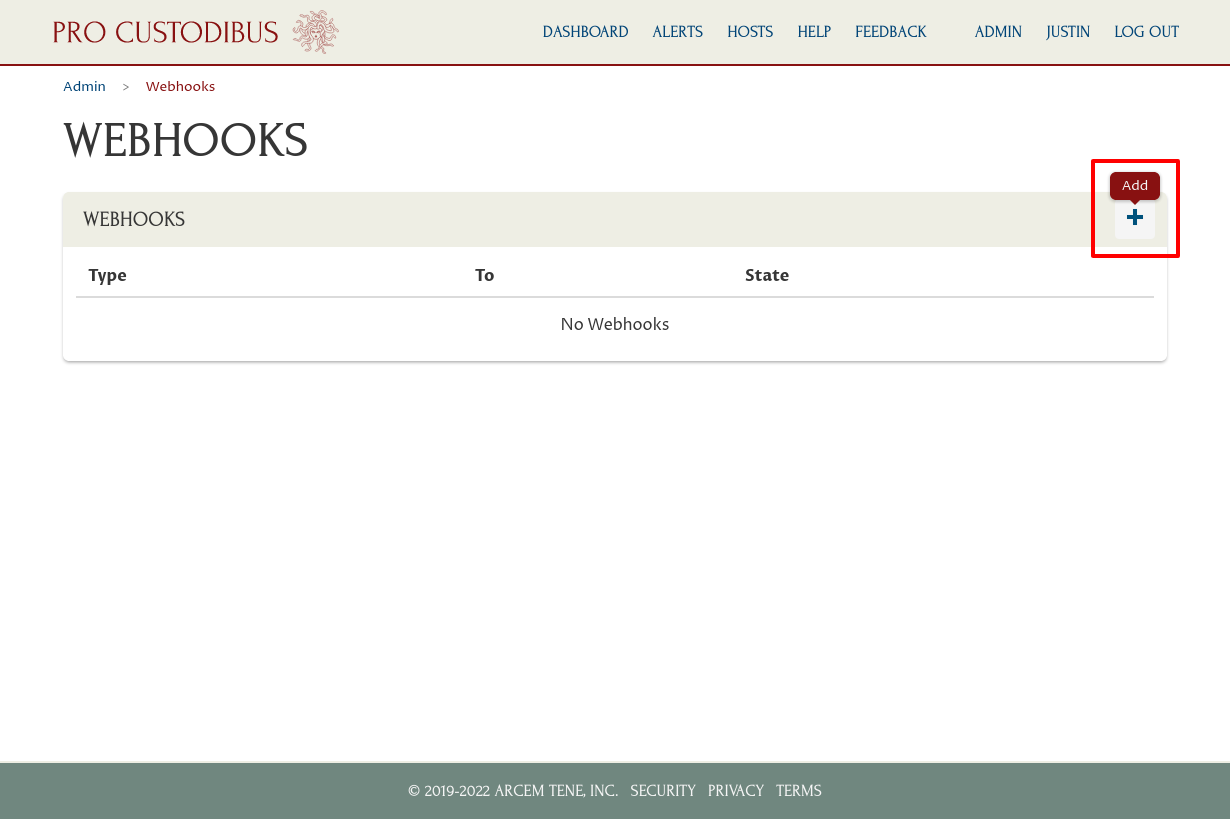
Click the Add icon on the top-right corner of the Webhooks panel:
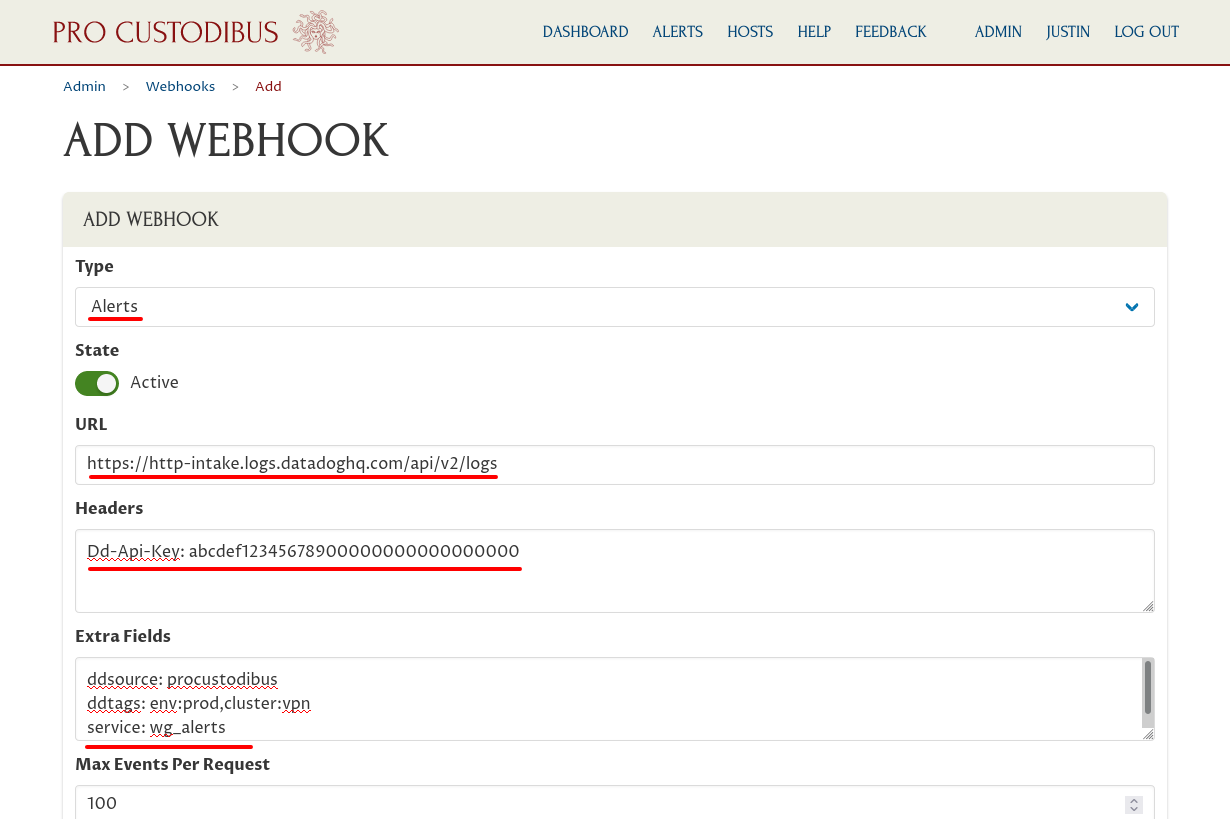
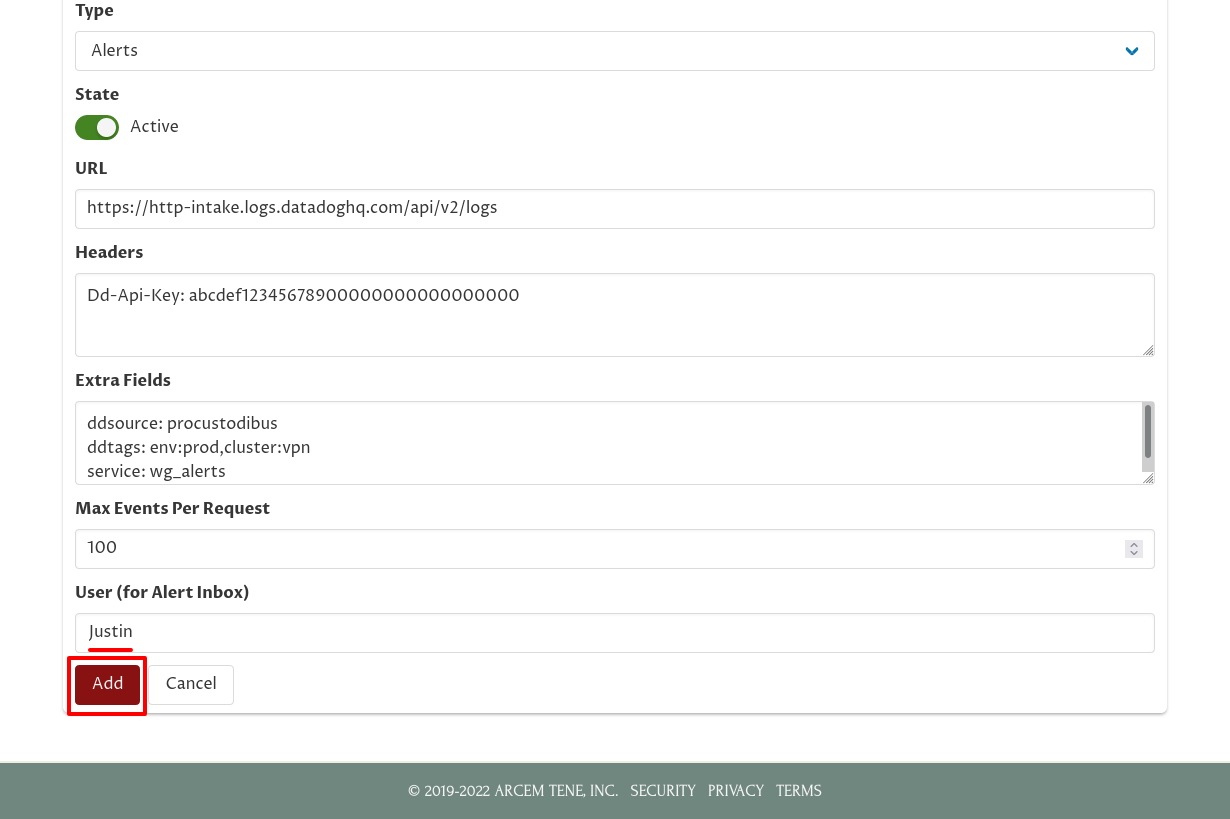
For the Type field, select Alerts. For URL, enter https://http-intake.logs.datadoghq.com/api/v2/logs. For Headers, enter Dd-Api-Key: followed by your Datadog API Key. For Extra Fields, enter ddsource: procustodibus on one line, any tags you want on another line (in this example, ddtags: env:prod,cluster:vpn), and service: wg_alerts on the last line:
|
Note
|
For Datadog sites other than |
Scroll down and for the User field, select yourself. Then click the Add button:
Set Up Datadog Log Pipeline for Alerts
Next, we’ll set up a Datadog log-management pipeline to map the alert attributes that Pro Custodibus emits into attributes that better fit Datadog’s built-in functionality.
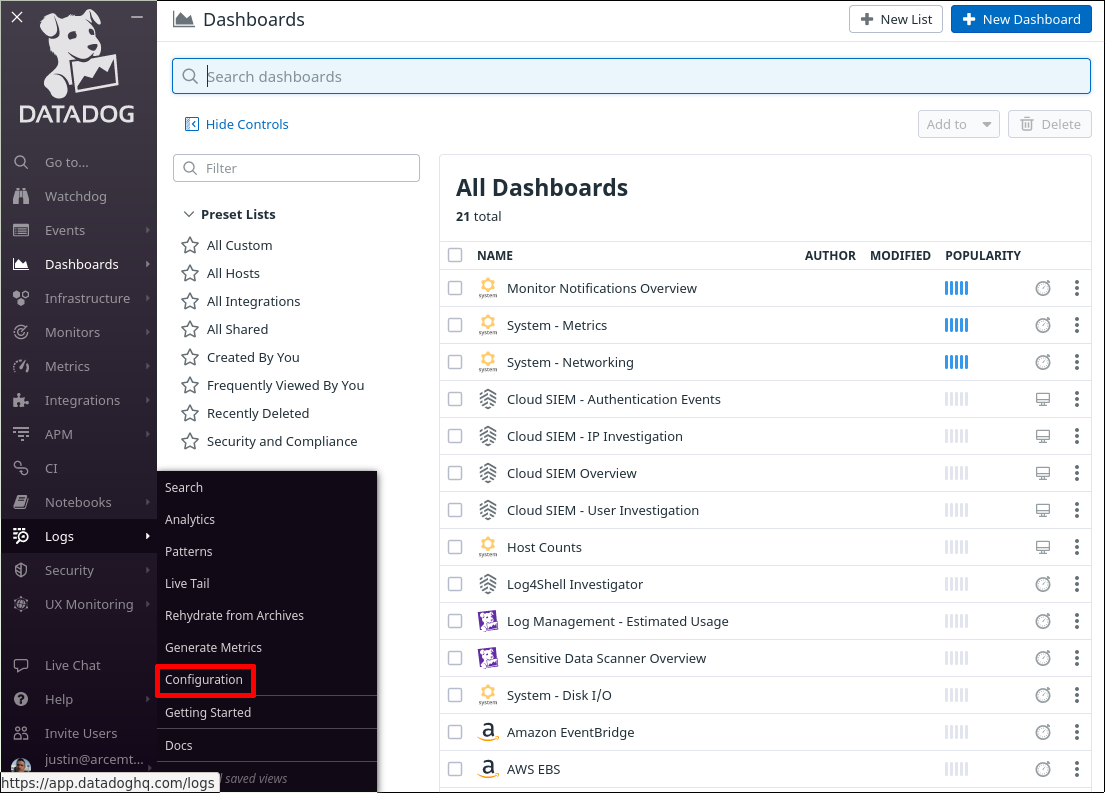
Log into the Datadog app, and navigate to the Configuration section of the Logs area of the app:
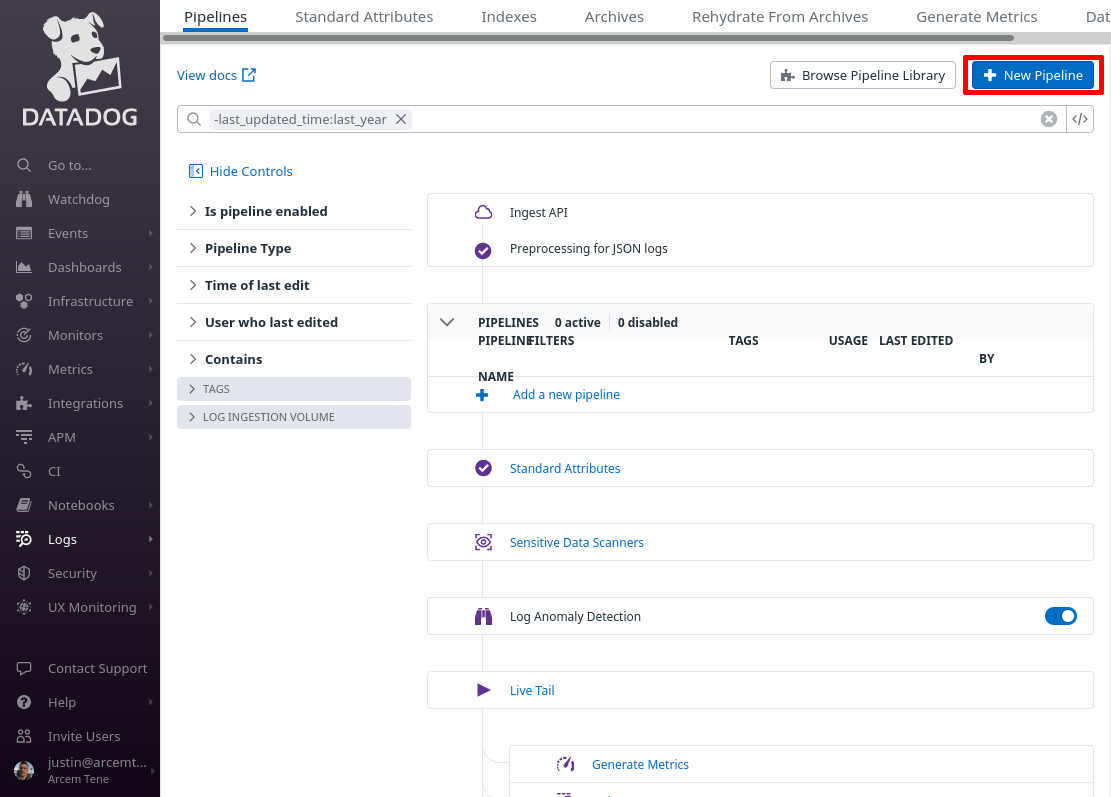
Click the New Pipeline button:
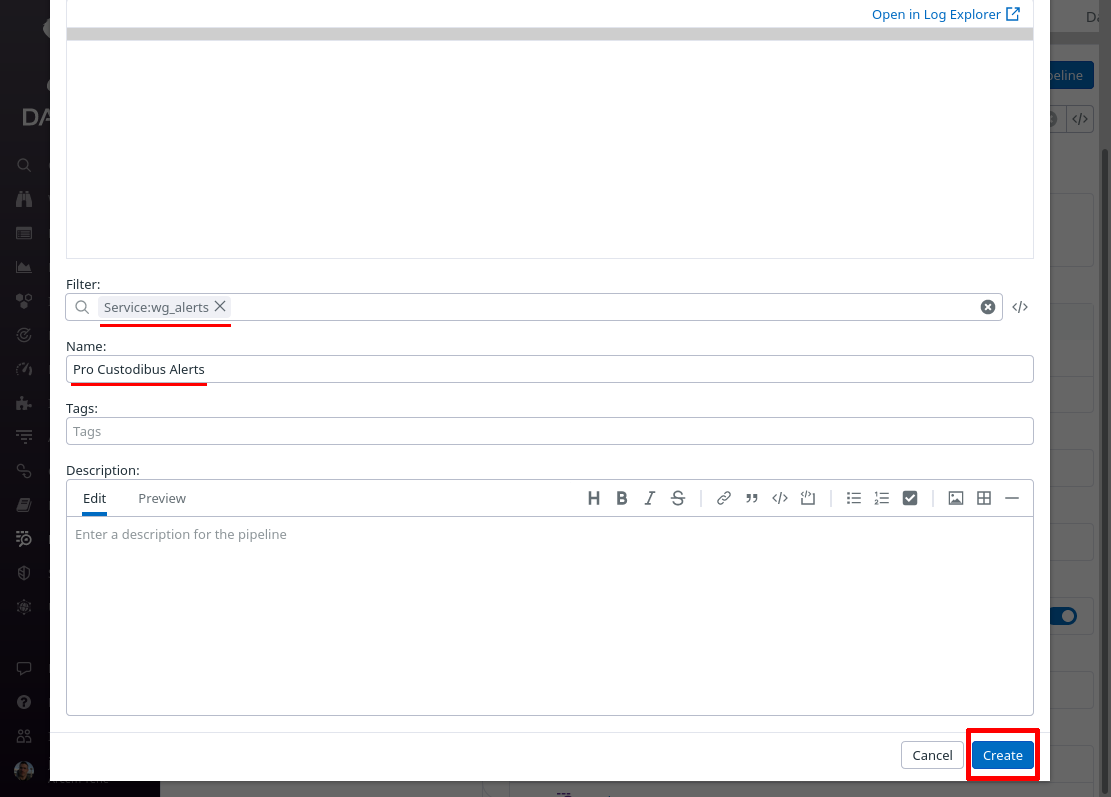
In the Filter field of the “Create Pipeline” dialog, enter service:wg_alerts — since this filter matches the “service” setting from the Pro Custodibus webhook “Extra Fields” settings above, this pipeline will process only logs pushed from that webhook. In the Name field, enter a useful display name, like “Pro Custodibus Alerts”. Then click the Create button:
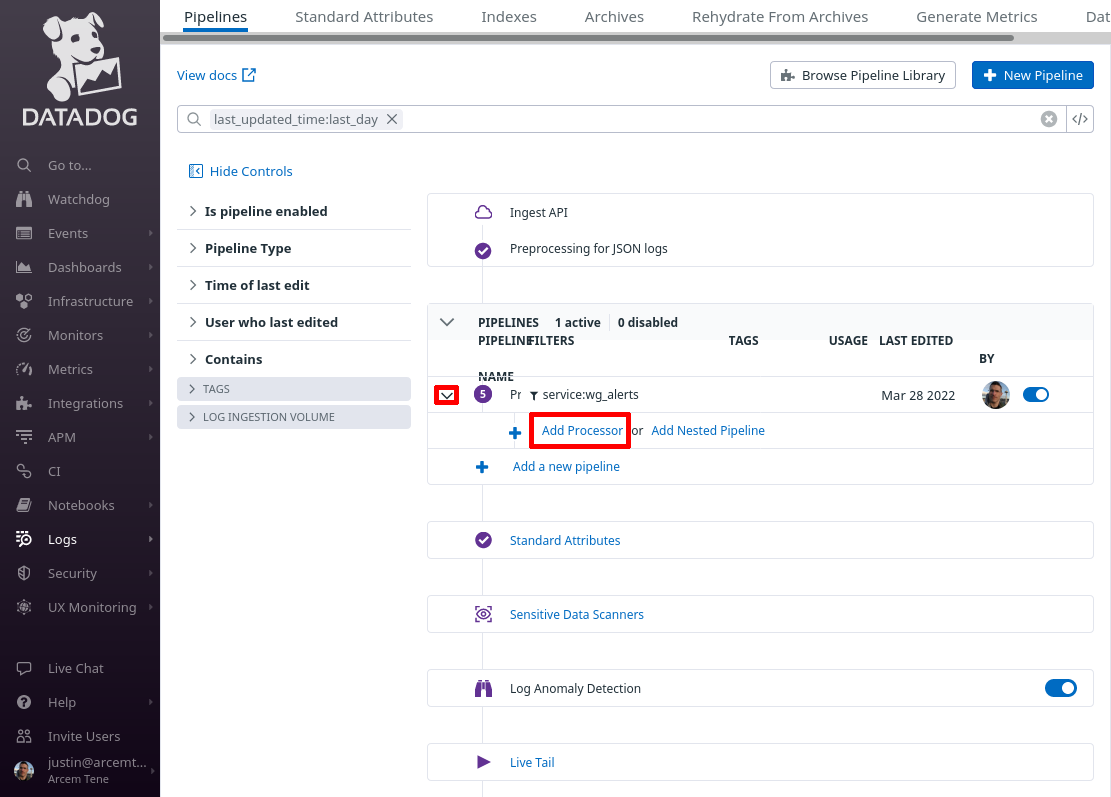
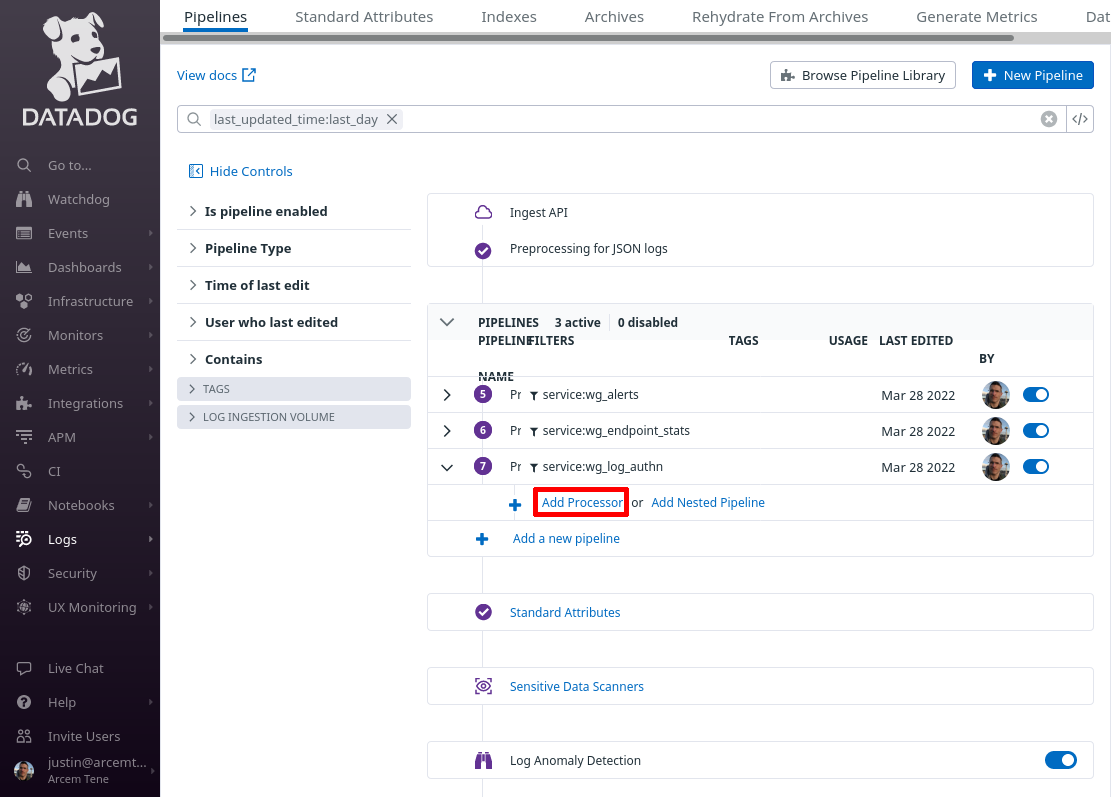
Toggle the expand button for the new pipeline, and then click the Add Processor link:
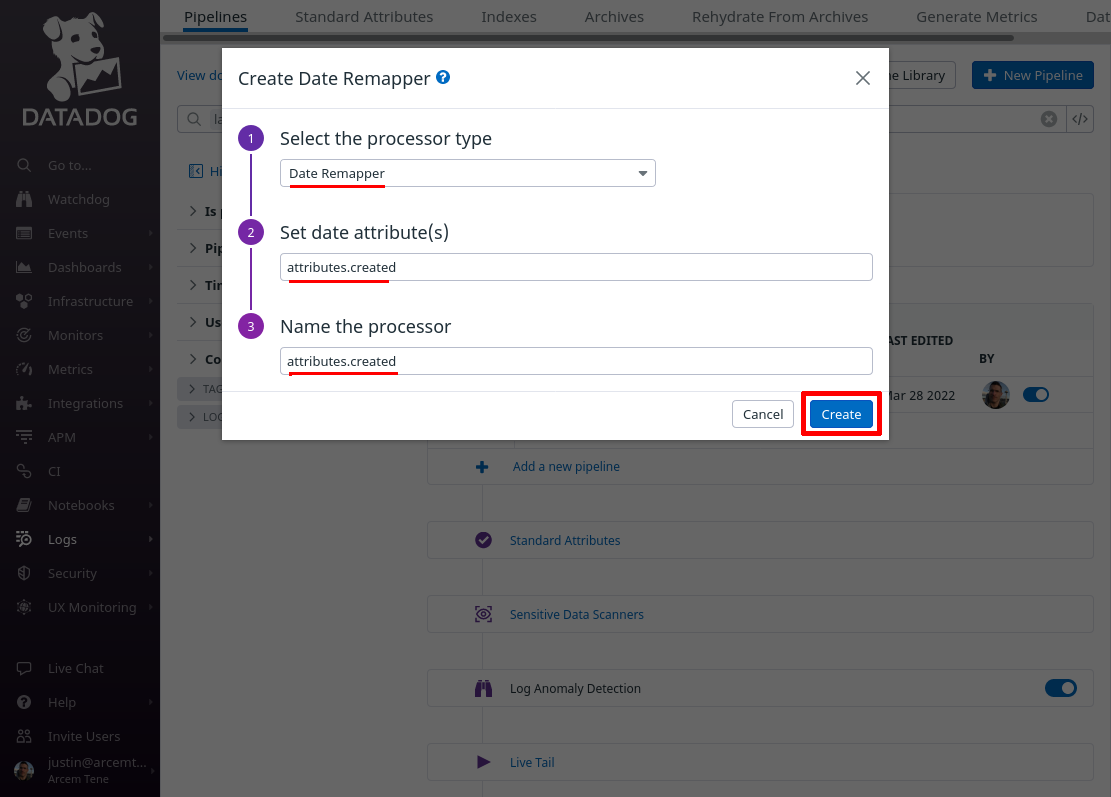
In the Select the processor type field, select Date Remapper. For the Set date attribute(s) field, enter attributes.created — this is the field Pro Custodibus uses to indicate the alert’s date. For the Name the processor field, enter a useful display name, like “attributes.created”. Then click the Create button:
Now click the Add Processor link again; this time we’ll add a category mapping from Pro Custodibus’ alert “danger” level to a custom Datadog attribute field.
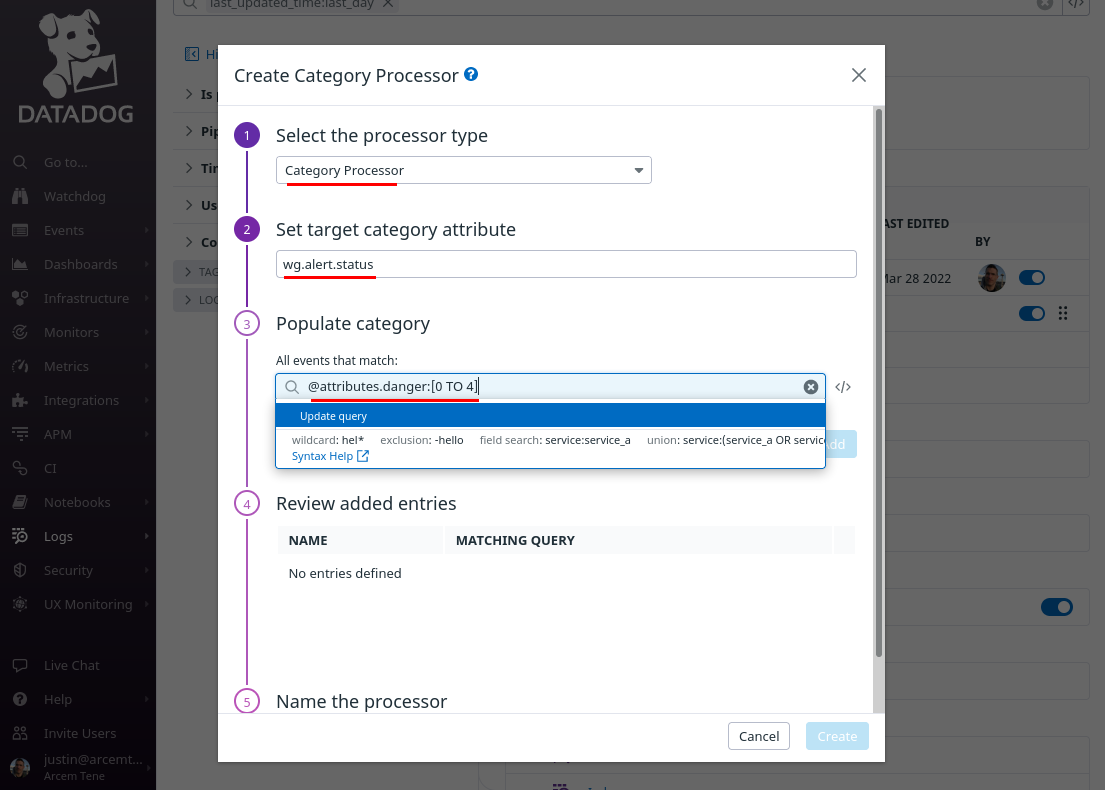
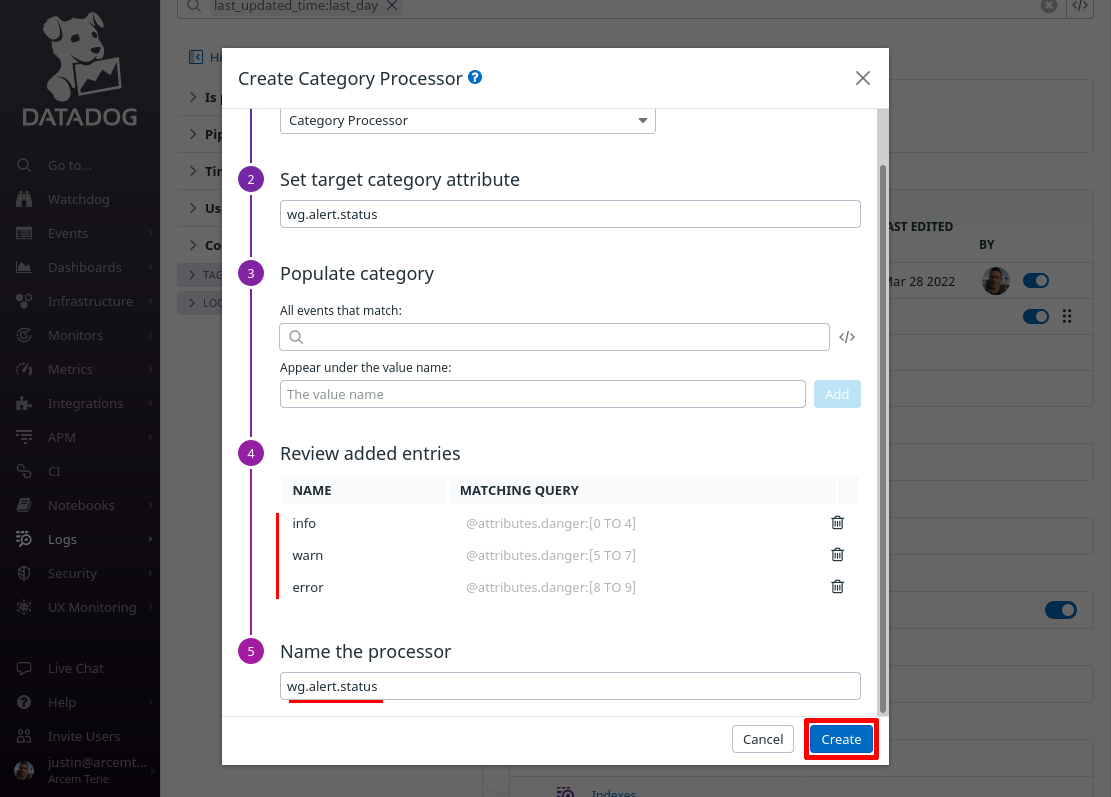
For the Select processor type field, select Category Processor. For the Set target category attribute field, enter wg.alert.status (this is the name of the new Datadog attribute we’ll create; if you already have a standard attribute you use for custom event status, you may want to use that attribute here instead).
For the Populate category section, we’ll add three categories. First, in the All events that match field, enter @attributes.danger:[0 TO 4]:
|
Note
|
Once you enter this query expression, Datadog will change its display to |
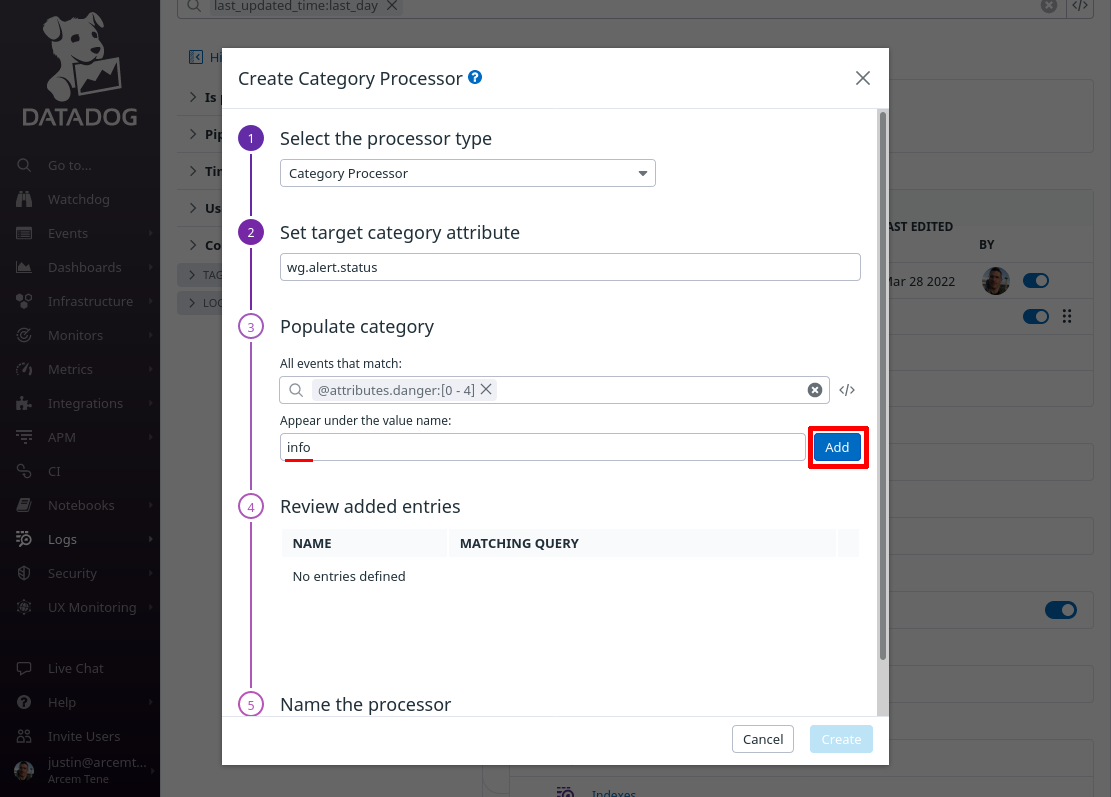
In the Appear under the value name field, enter info. Then click the Add button:
Do the same for two more event queries: @attributes.danger:[5 TO 7] and @attributes.danger:[8 TO 9]; give them names of warn and error.
Then for the Name the processor field, enter a useful display name like “wg.alert.status”, and click the Create button:
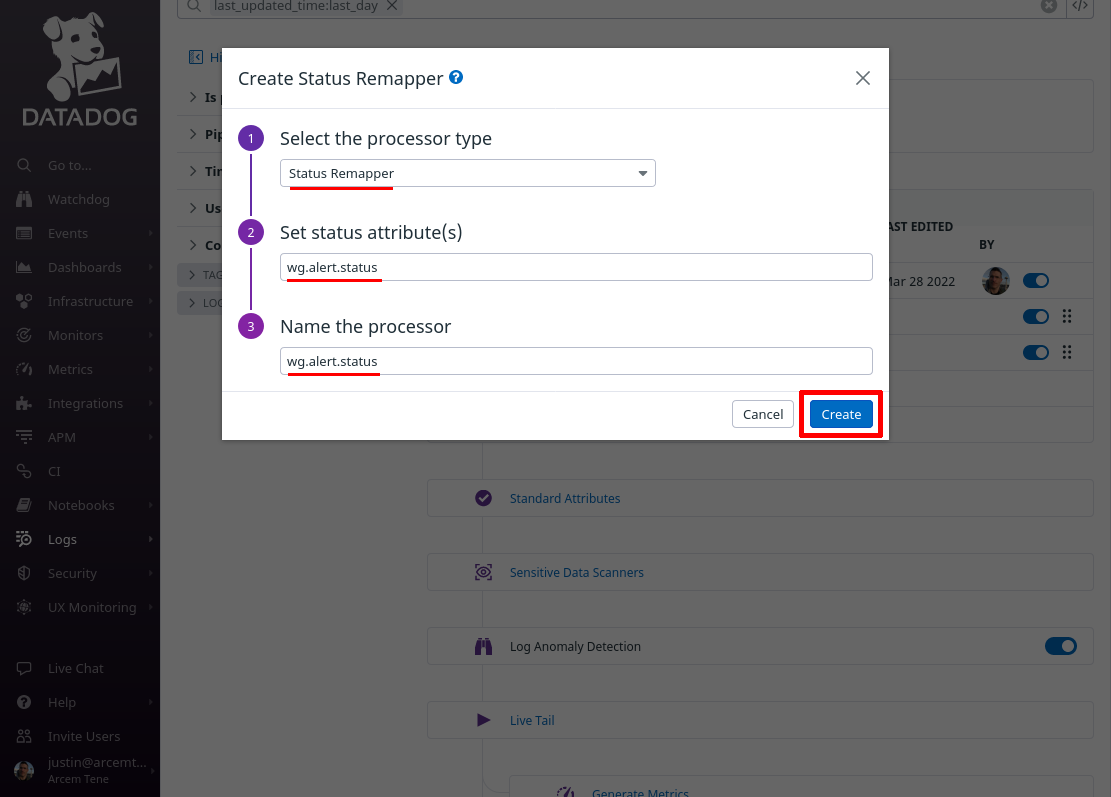
Click the Add Processor link again; now we’ll map the custom wg.alert.status attribute we just created to Datadog’s internal log status setting.
For the Select processor type field, select Status Remapper. For the Set status attribute(s) field, enter wg.alert.status (the same field we created with the Category Processor above).
For the Name the processor field, enter a useful display name like “wg.alert.status”, and click the Create button:
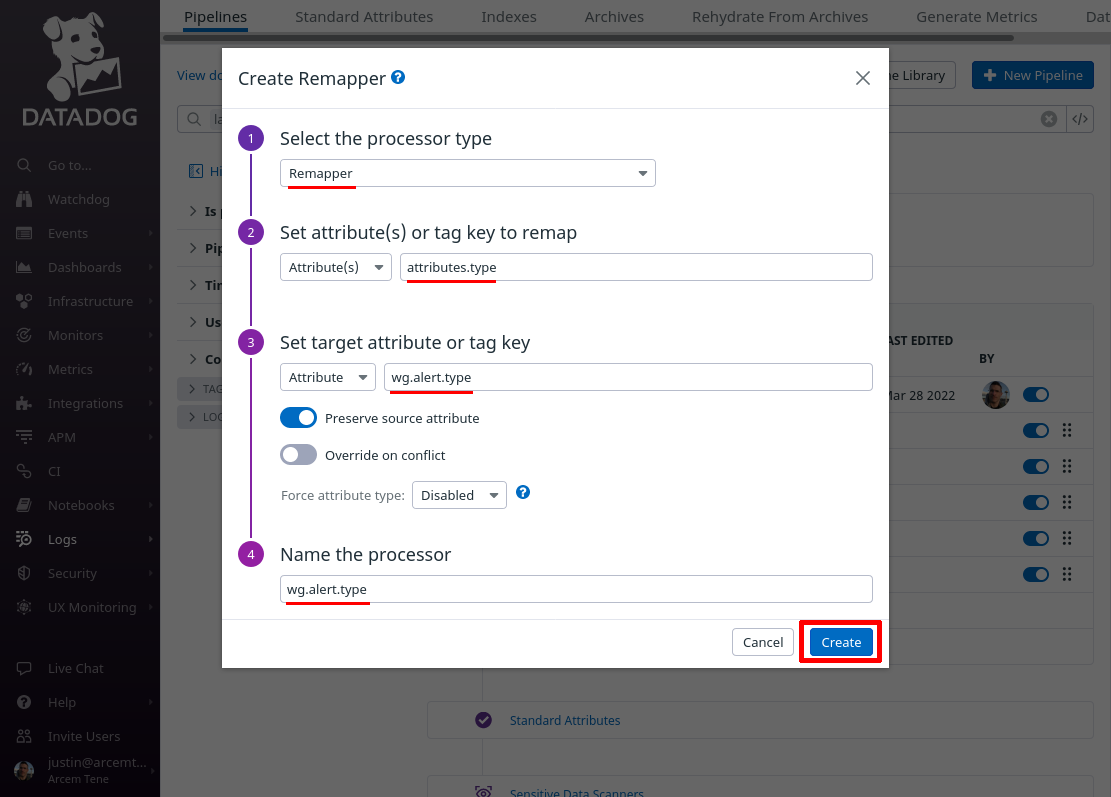
Click the Add Processor link again; this time we’ll map Pro Custodibus’ alert type to a new custom Datadog attribute for our own convenience.
For the Select processor type field, select Remapper. For the Set attribute(s) or tag key to remap field, enter attributes.type (this is the name of the attribute Pro Custodibus uses for alert type).
For the Set target attribute or tag key field, enter wg.alert.type (this is the name of the new Datadog attribute we’ll create; if you already have a standard attribute you use for custom event types, you may want to use that attribute here instead).
For the Name the processor field, enter a useful display name like “wg.alert.type”, and click the Create button:
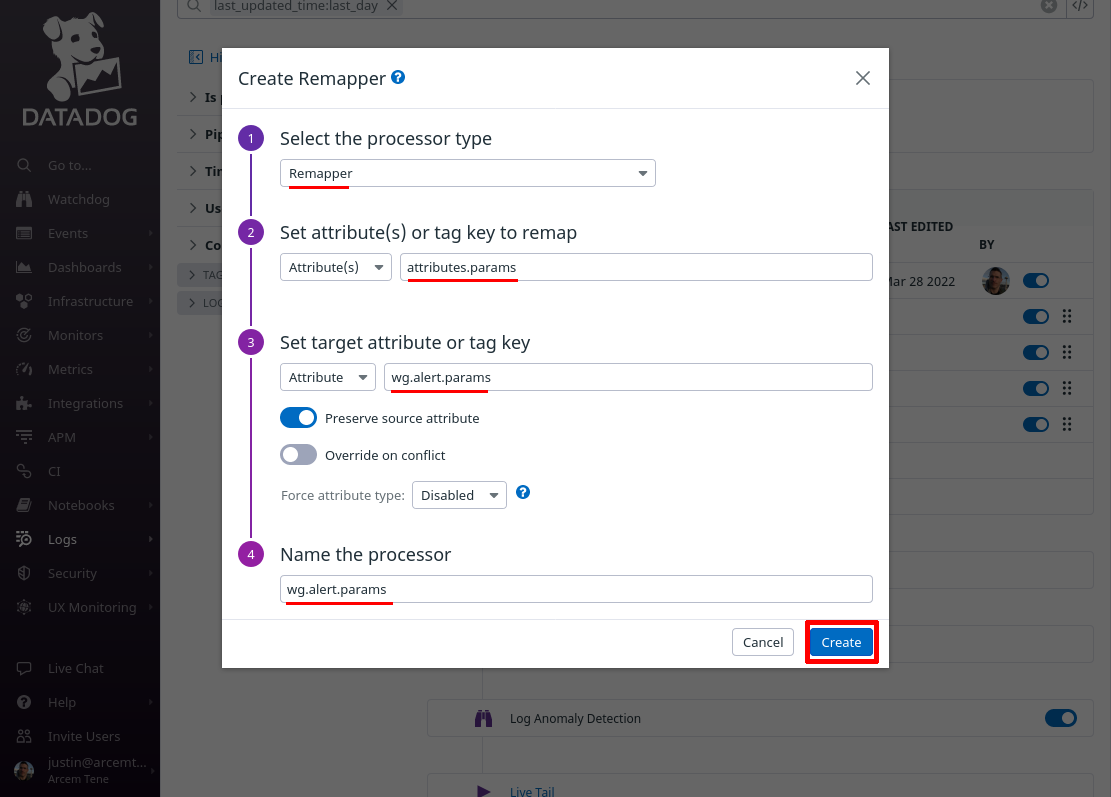
Click the Add Processor link one more time; lastly we’ll map Pro Custodibus’ alert detail parameters to a new custom Datadog attribute, again for our own convenience.
For the Select processor type field, again select Remapper. For the Set attribute(s) or tag key to remap field, enter attributes.params (this is the name of the attribute Pro Custodibus uses for alert detail parameters).
For the Set target attribute or tag key field, enter wg.alert.params (this is the name of the new Datadog attribute we’ll create).
For the Name the processor field, enter a useful display name like “wg.alert.params”, and click the Create button:
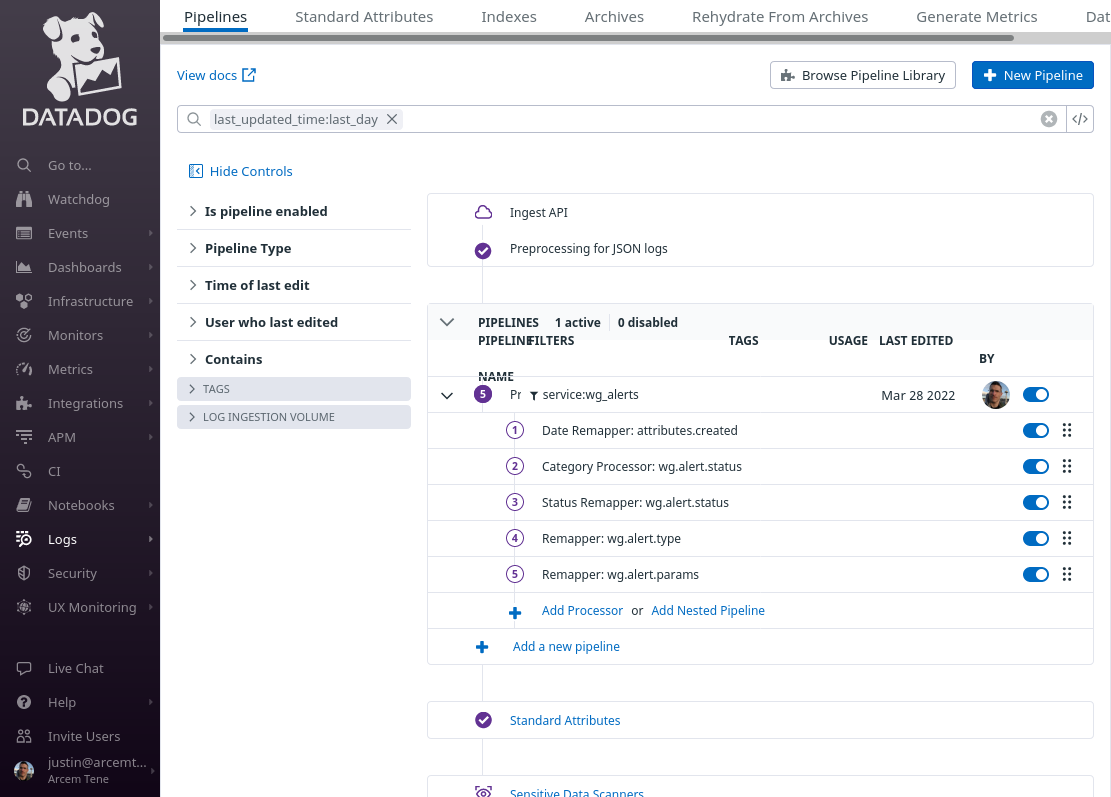
At the end of this process, your alerts pipeline should look like the following:
Set Up Datadog Log Explorer for Alerts
Next, we’ll set up the Datadog log explorer with some useful log facets and a custom view to show just our Pro Custodibus alerts. At this point, you probably won’t have any Pro Custodibus alerts yet to view in Datadog. That’s okay, we can set things up in the log explorer now, and you can come back and view alerts generated later.
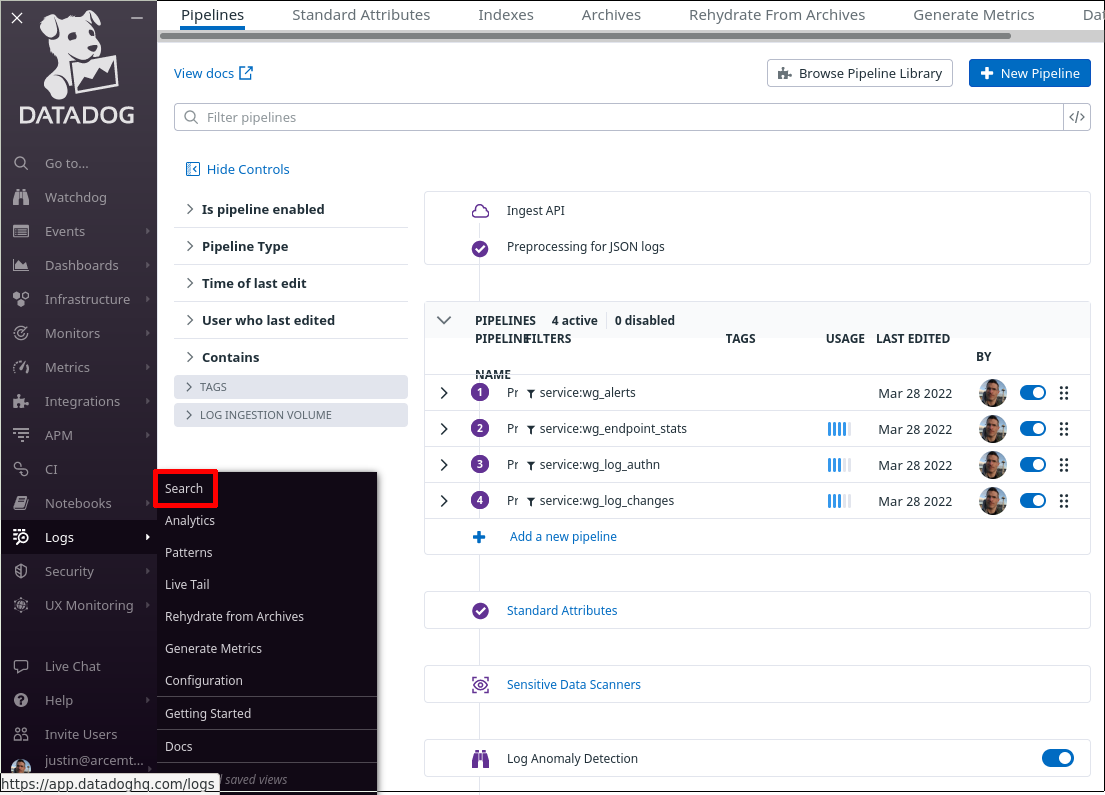
In the Datadog app, navigate to the Search section of the Logs area of the app:
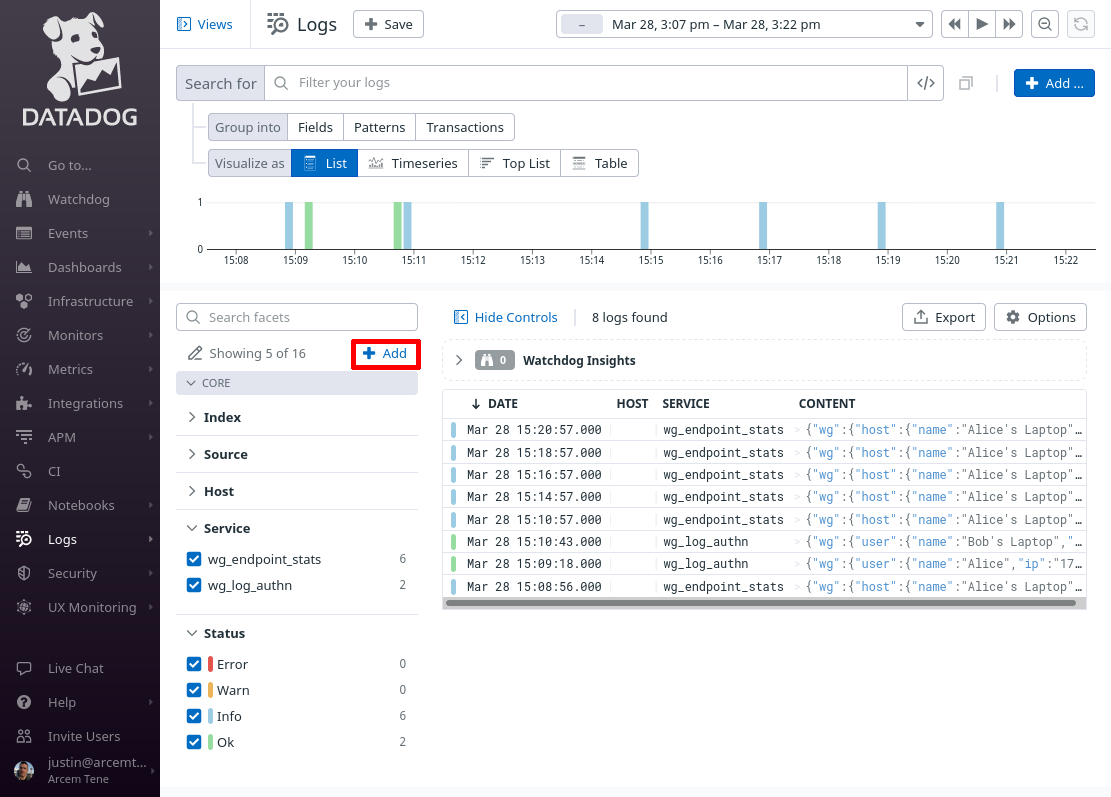
In the facets pane on the right side of the log search page, click the Add button:
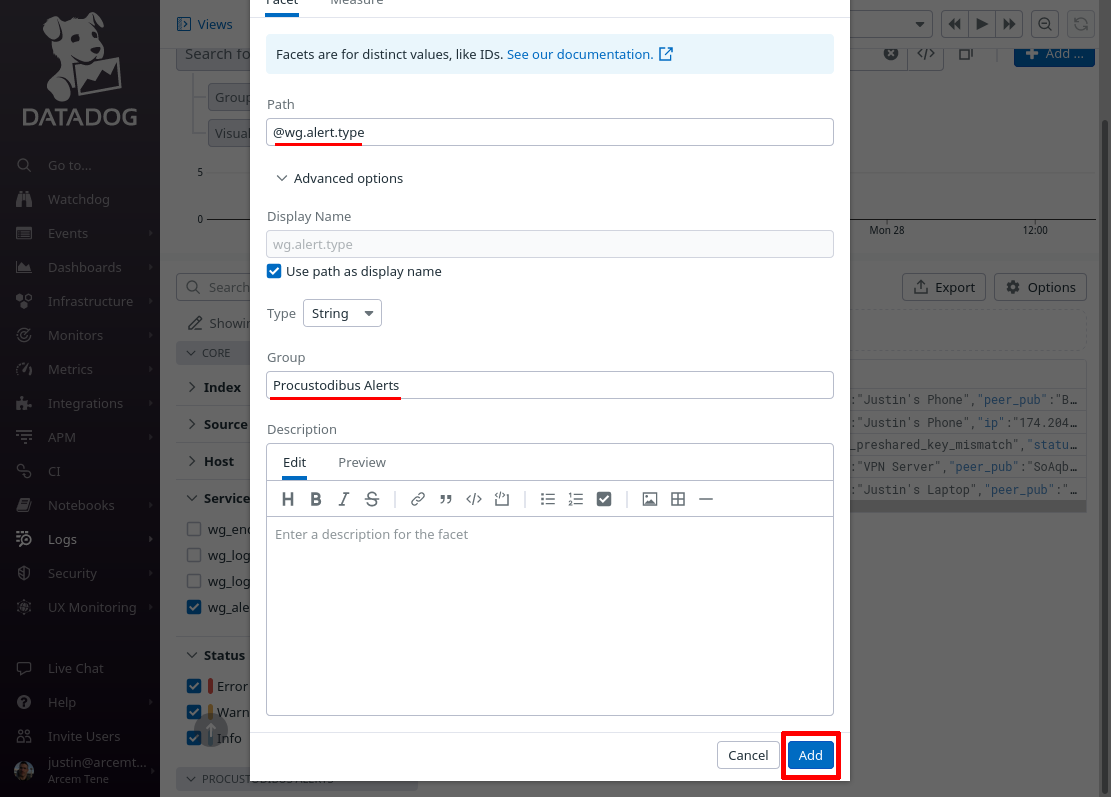
On the “Add facet” dialog, in the Path field, enter @wg.alert.type (or whatever Datadog attribute you remapped from the source Pro Custodibus attributes.type attribute in the previous section). For the Group field, enter Procustodibus Alerts (or the name of some custom group that you’d rather use). Then click the Add button:
Do the same for these other attributes:
-
wg.alert.params.endpoint -
wg.alert.params.endpoint_ips -
wg.alert.params.endpoints -
wg.alert.params.host -
wg.alert.params.hosts -
wg.alert.params.interface -
wg.alert.params.interfaces -
wg.alert.params.ip -
wg.alert.params.ips -
wg.alert.params.peer -
wg.alert.params.peers
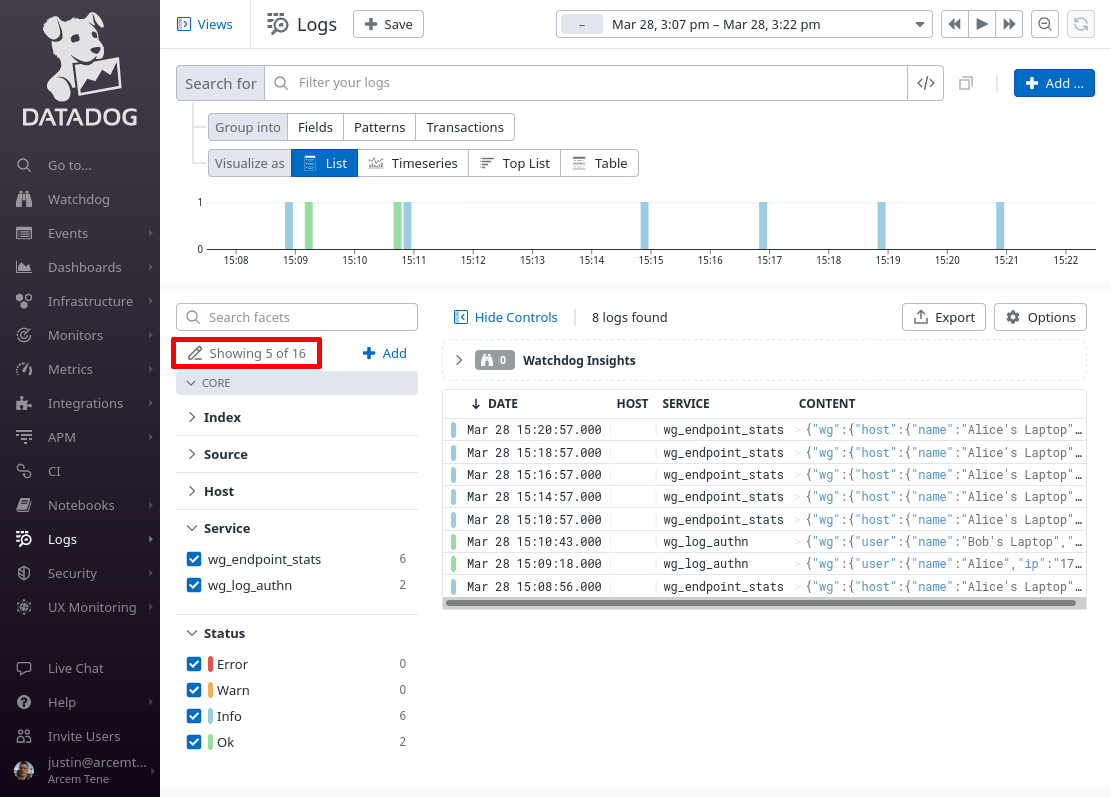
These are the most common alert detail parameters you’ll see from Pro Custodibus. When done, click the Showing X of Y link in the facets pane:
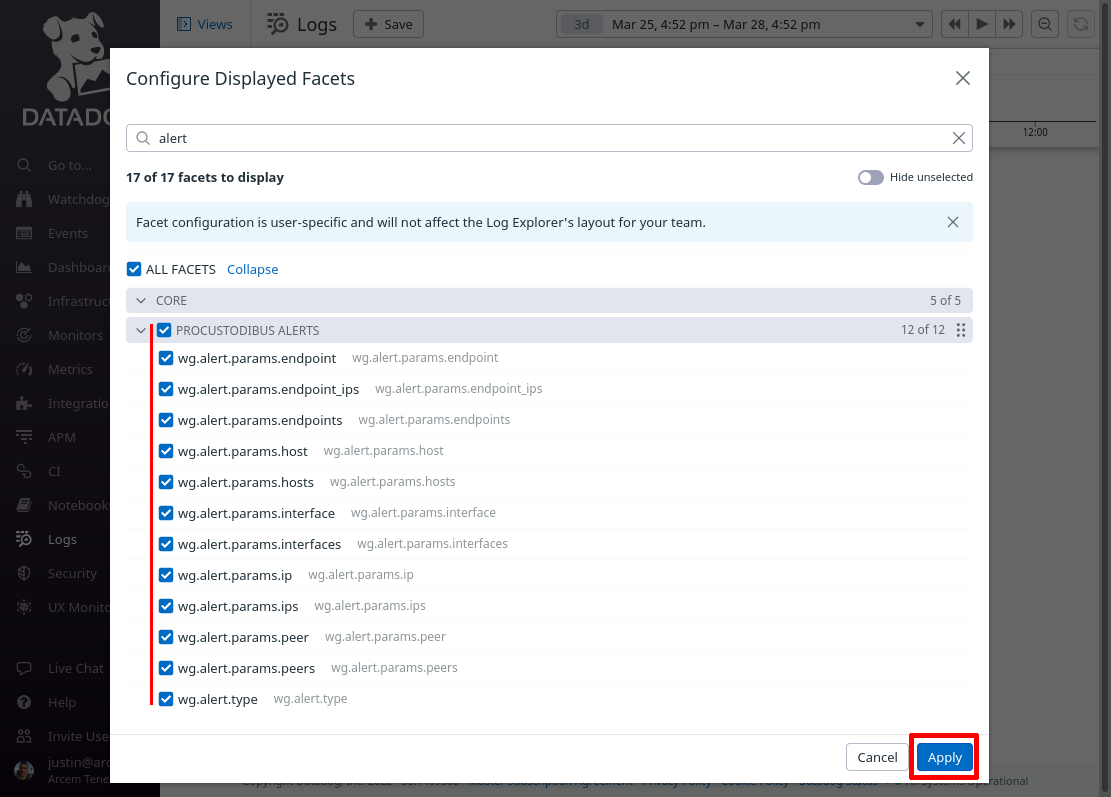
Select all the facets you just added, so that you can see them in the facets pane of the main log explorer page, and click the Apply button:
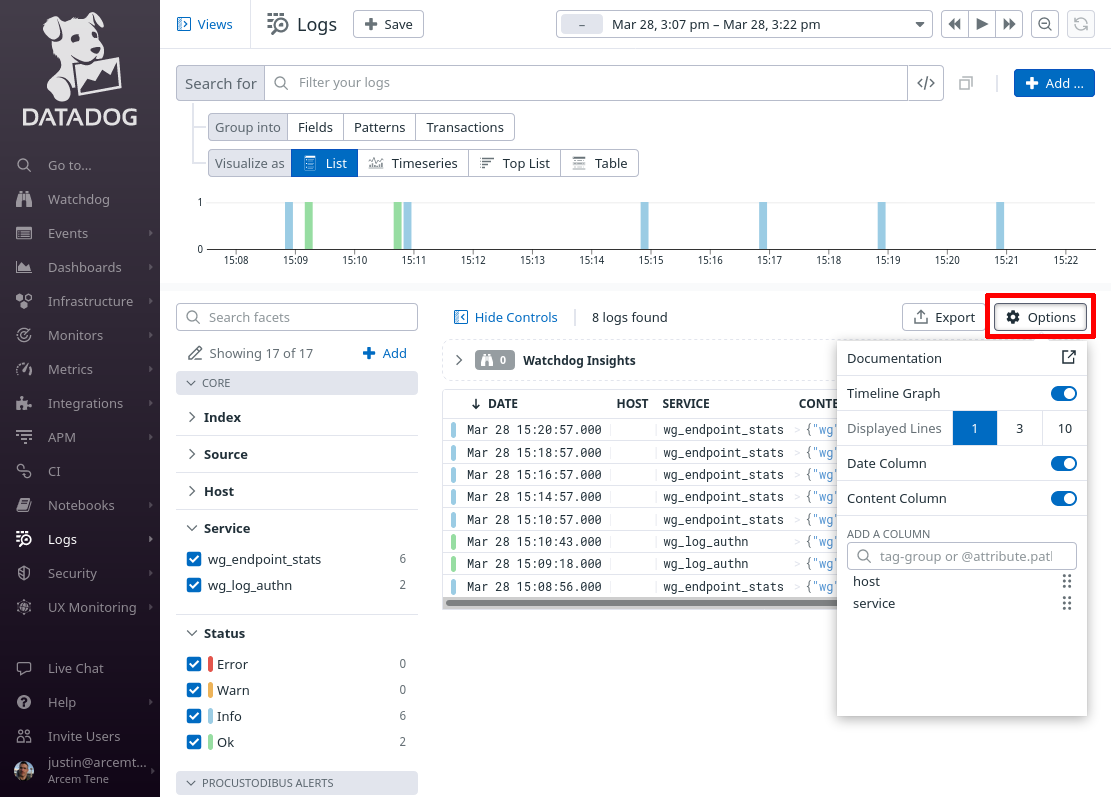
Then click the Options button above the list of log entries to customize the columns displayed in the list:
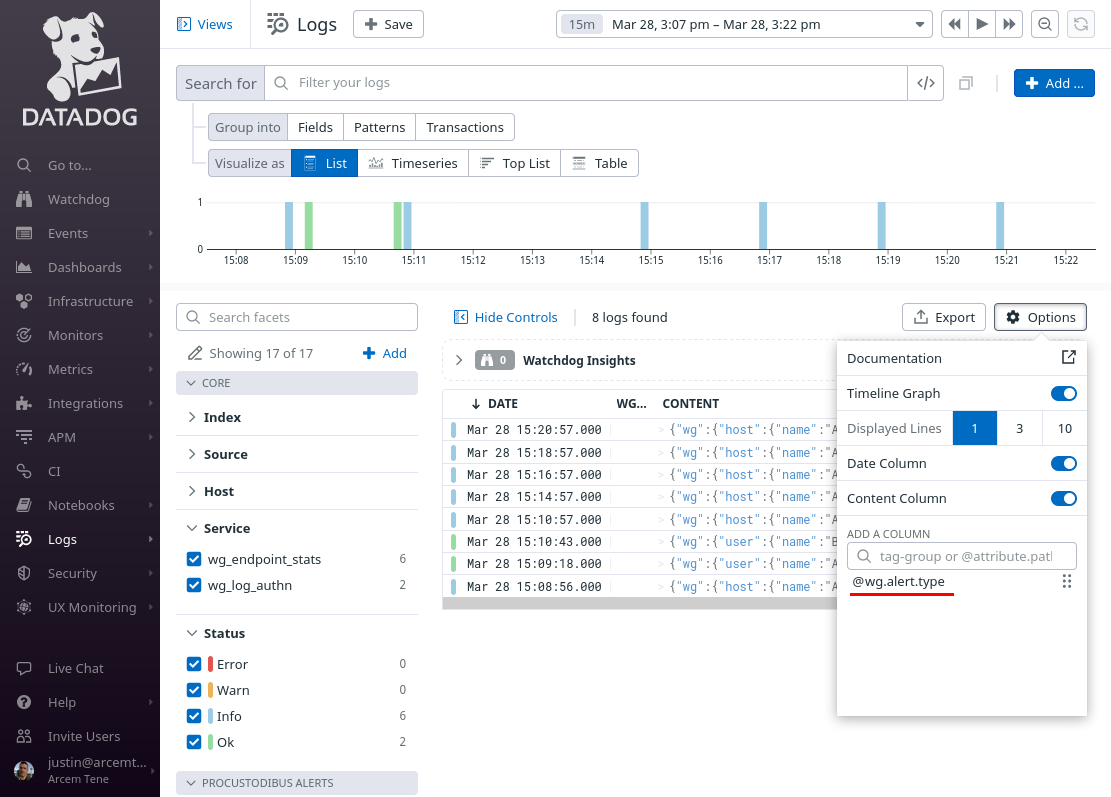
Remove the existing columns (other than Date and Content), and add the @wg.alert.type column:
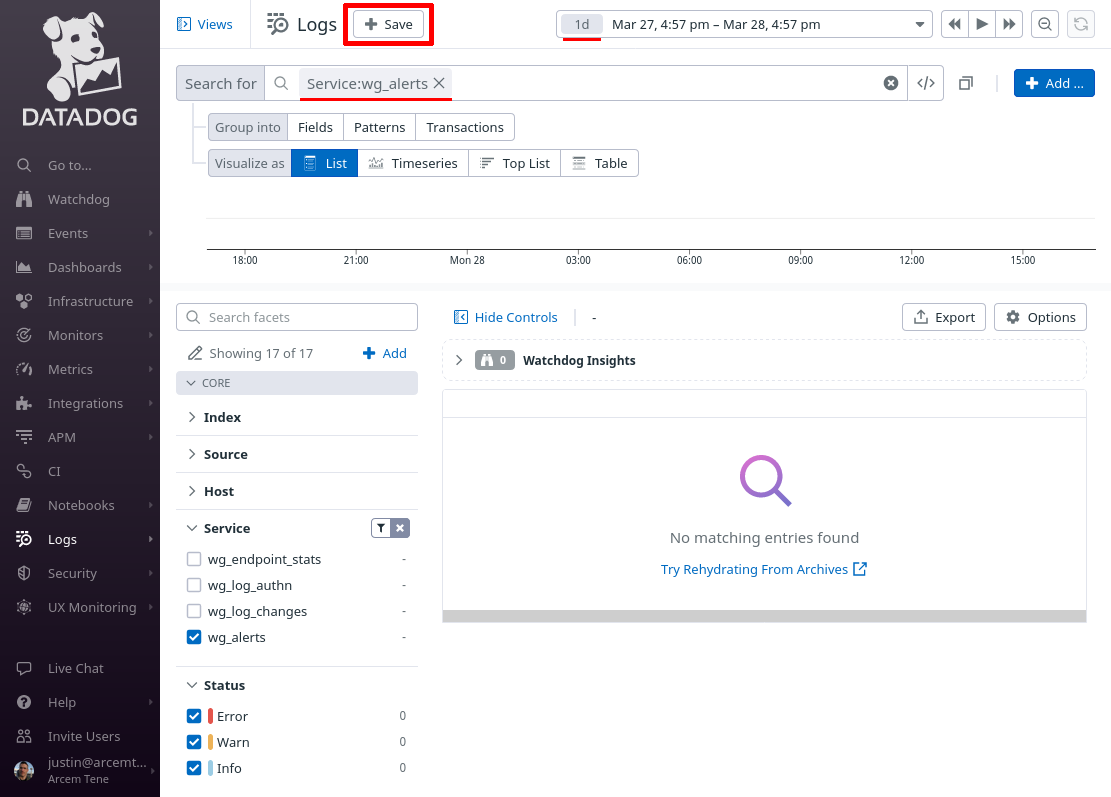
Change the Search for field to service:wg_alerts, and the time range to the past day (or past week). Then click the Save button:
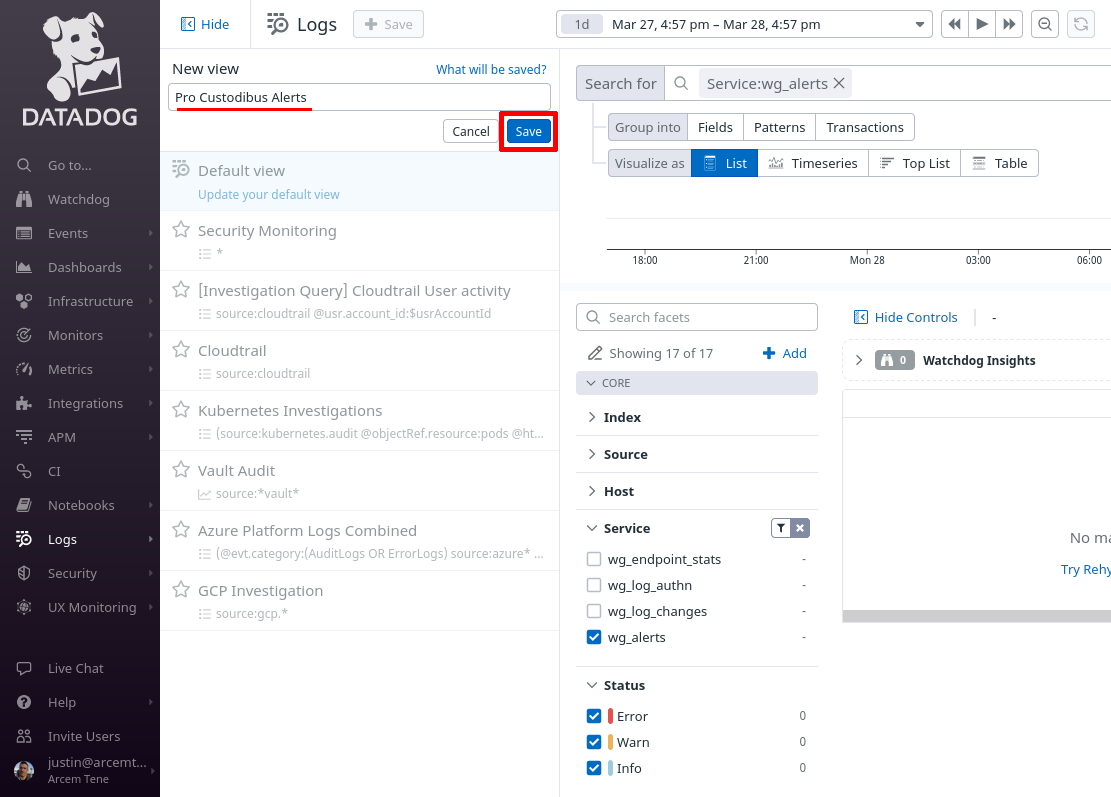
In the New view field, enter Pro Custodibus Alerts, and click the Save button:
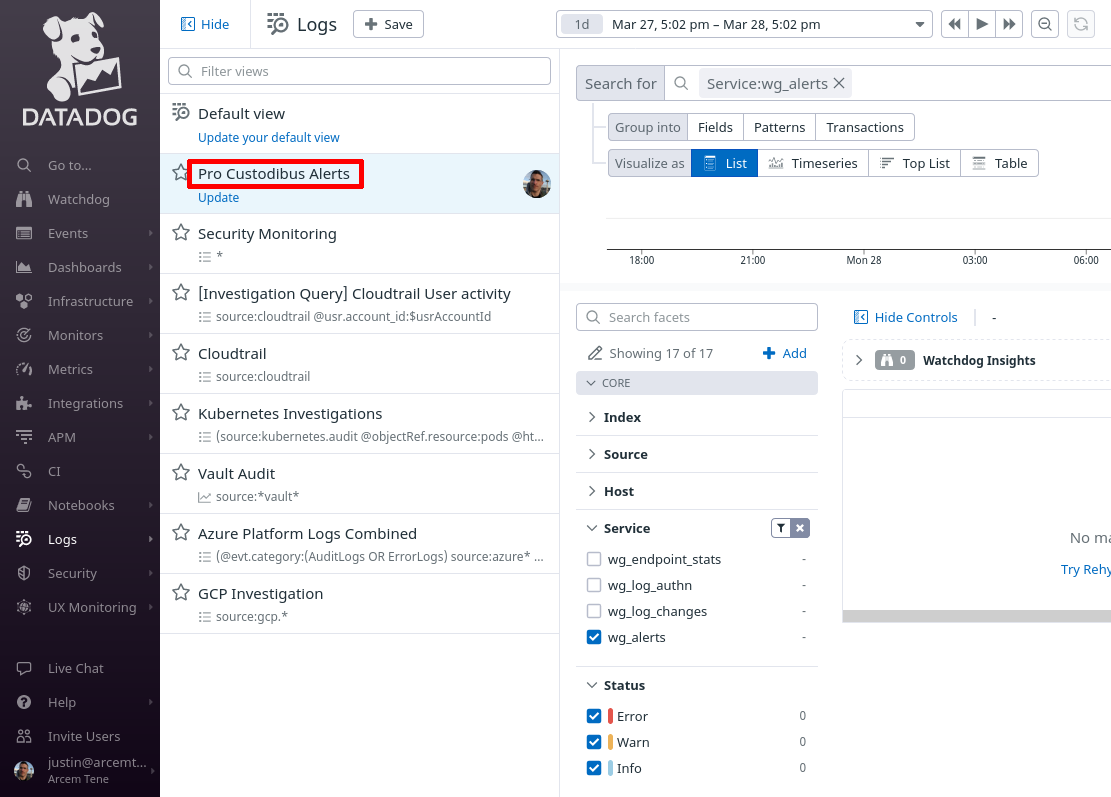
You can return to this view later to when you want to check on your Pro Custodibus alerts:
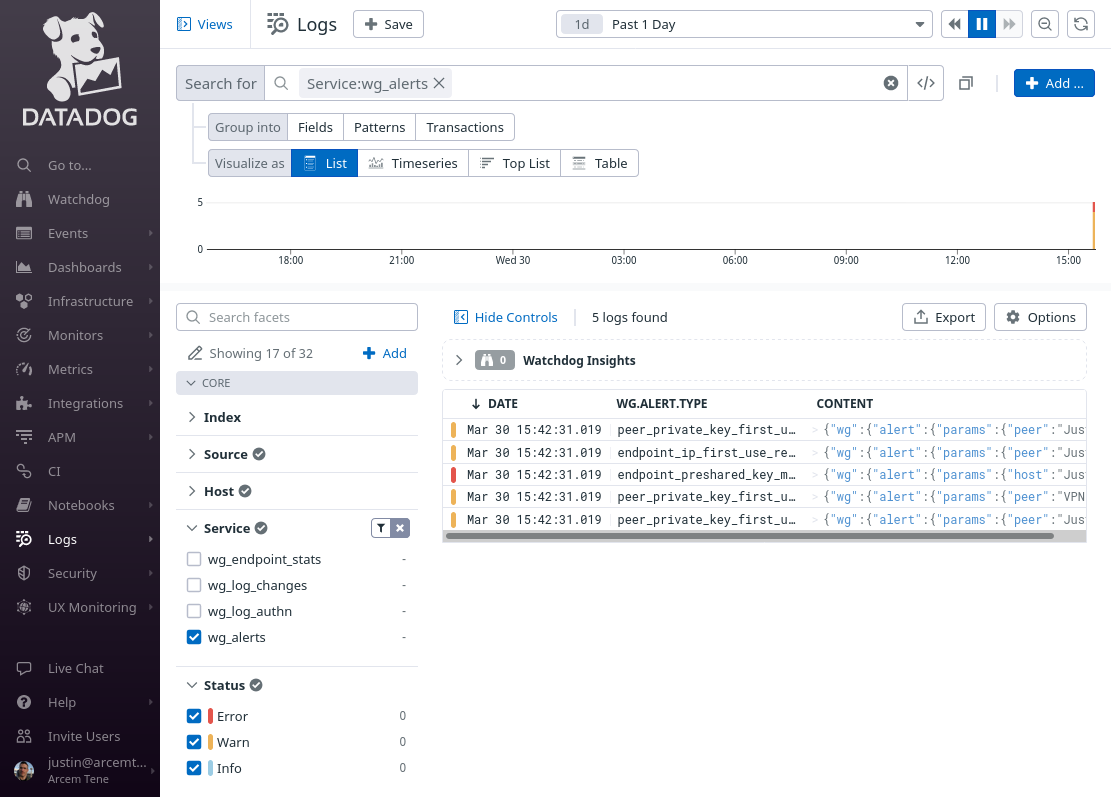
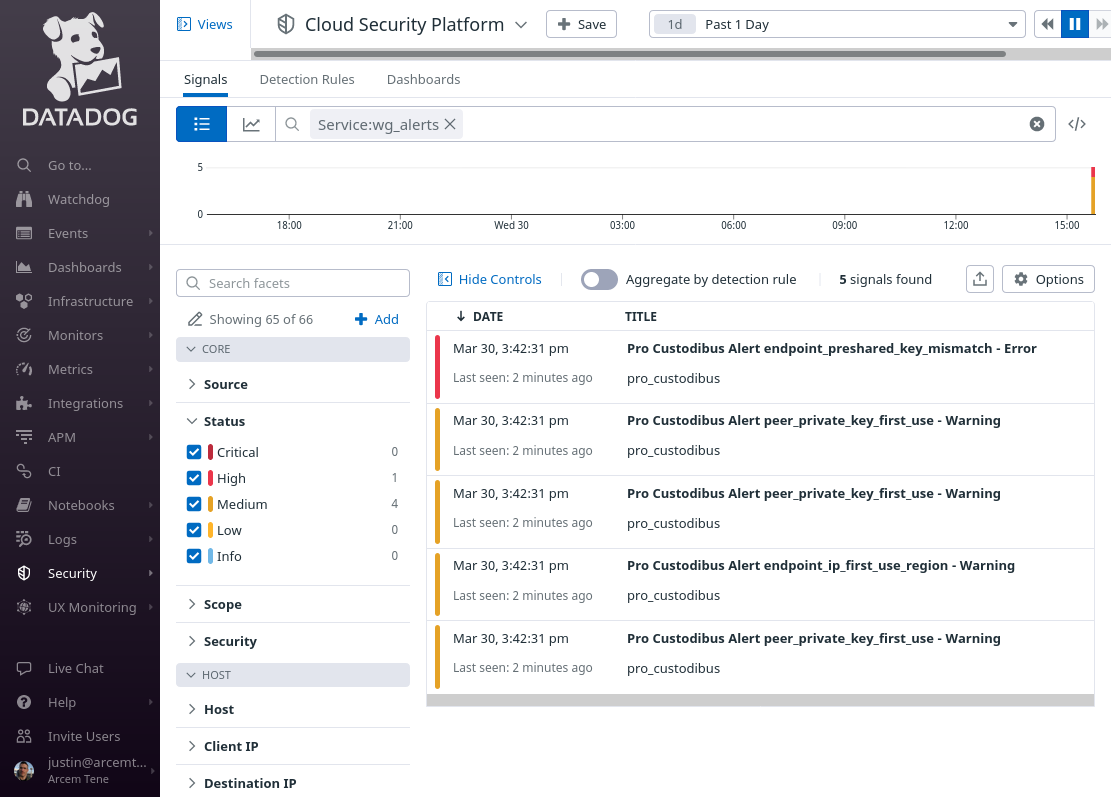
Once Pro Custodibus has generated some alerts, you’ll see something like this:
Set Up Datadog Security Detection Rules for Alerts
Finally, we’ll set up Datadog’s Cloud SIEM with our first custom detection rule for Pro Custodibus alerts. You may want to set up a separate rule for each alert you’re interested in, but for now, we’ll set up a single rule that will capture a security signal for each Pro Custodibus alert sent to Datadog.
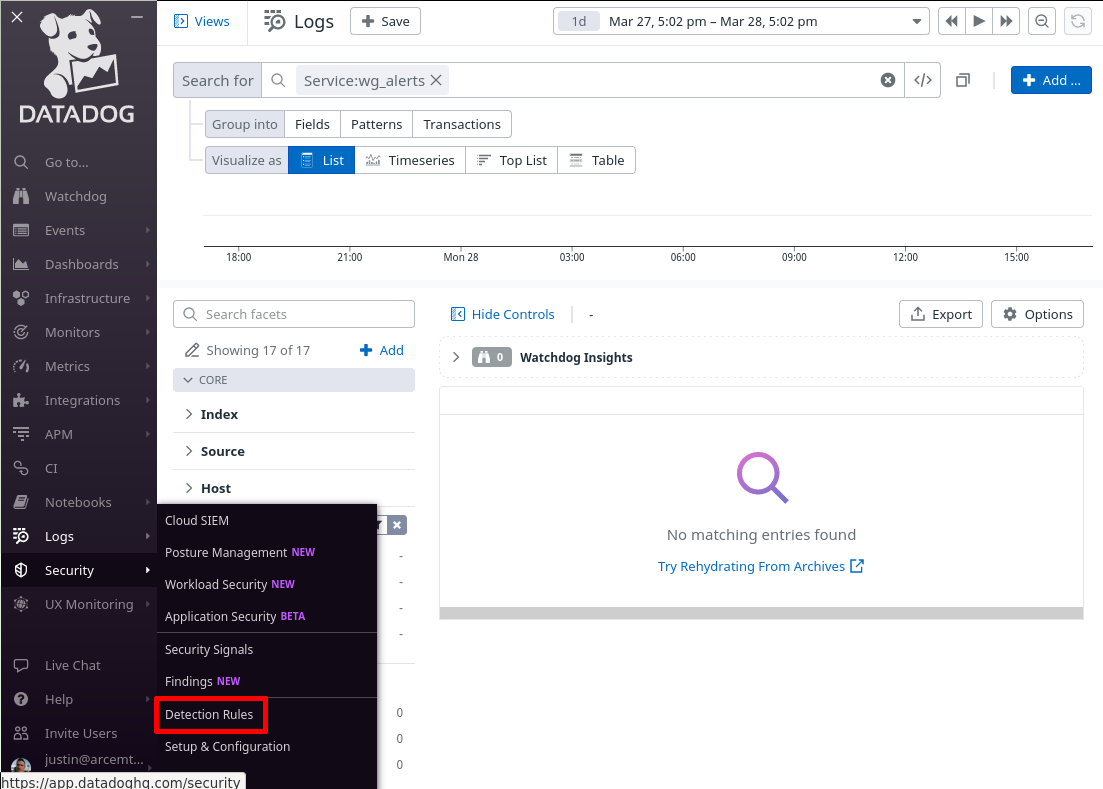
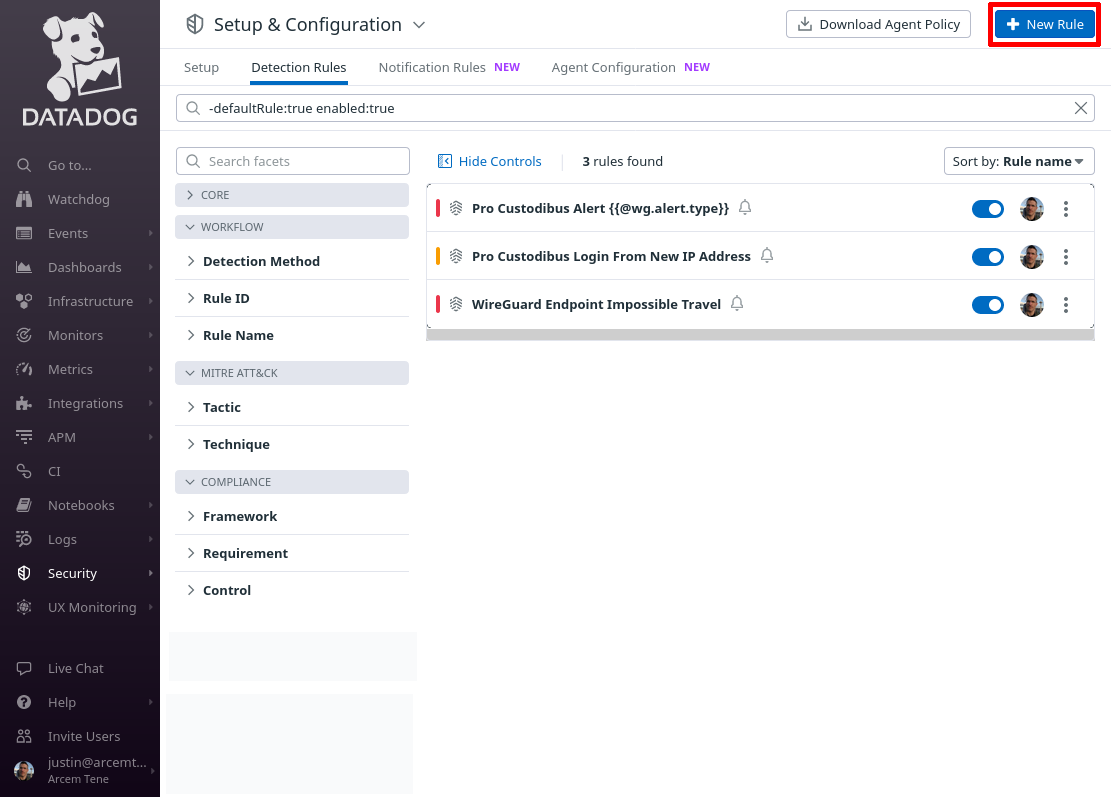
In the Datadog app, navigate to the Detection Rules section of the Security area of the app:
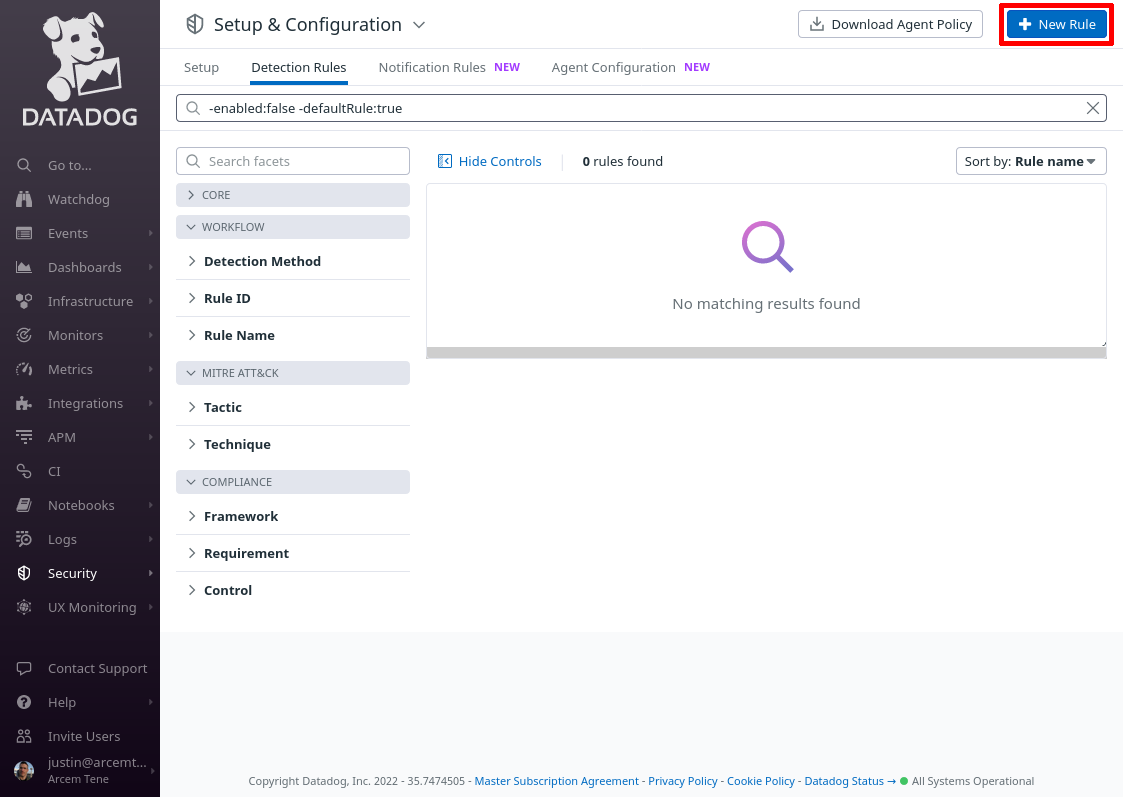
Click the New Rule button:
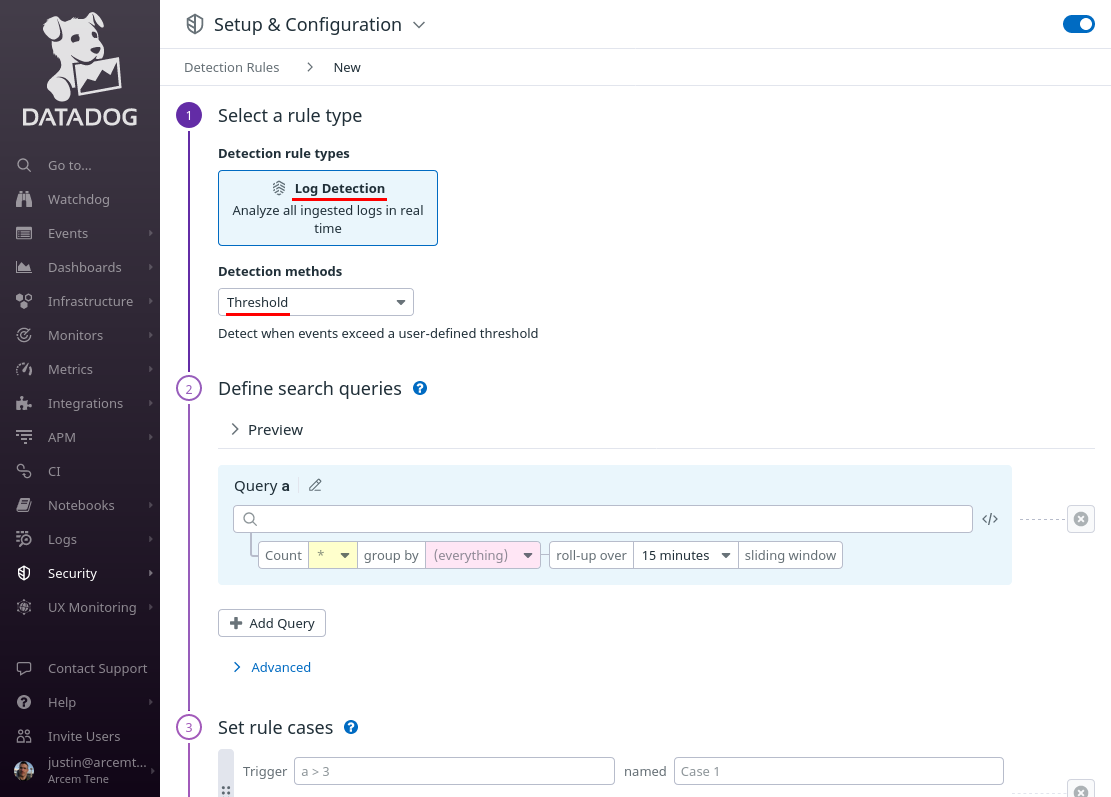
For Detection rule types, select Log Detection, and for Detection methods, select Threshold:
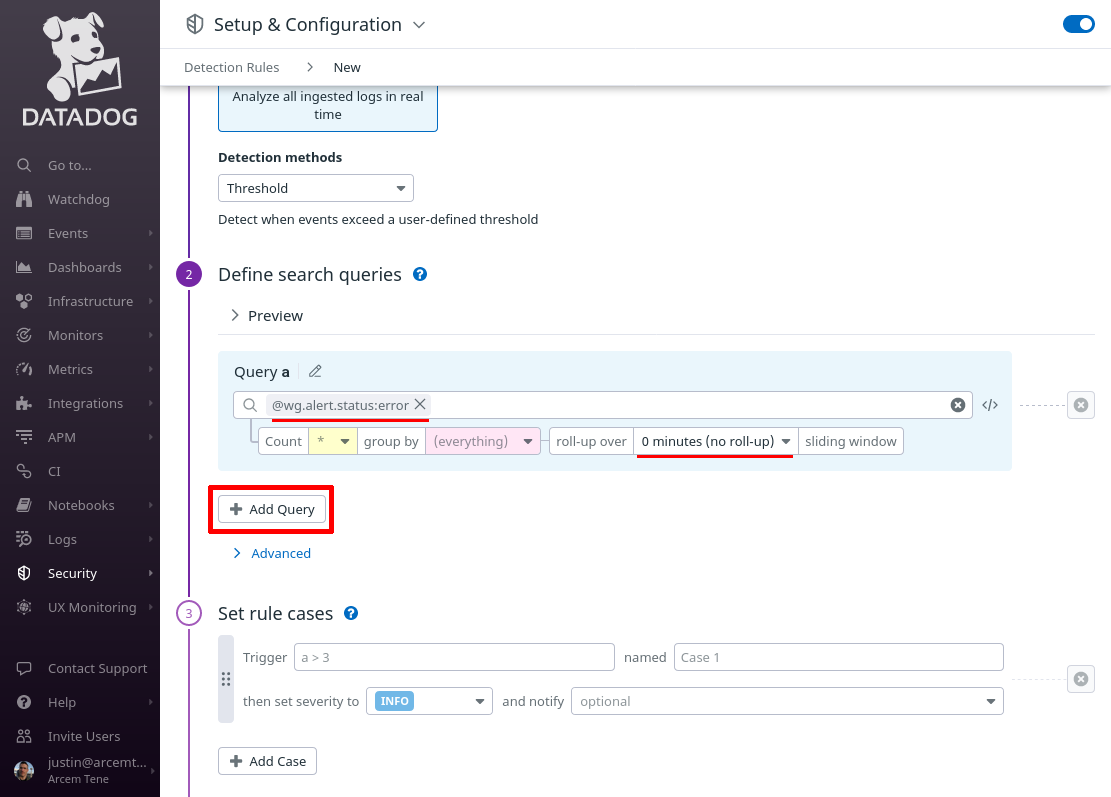
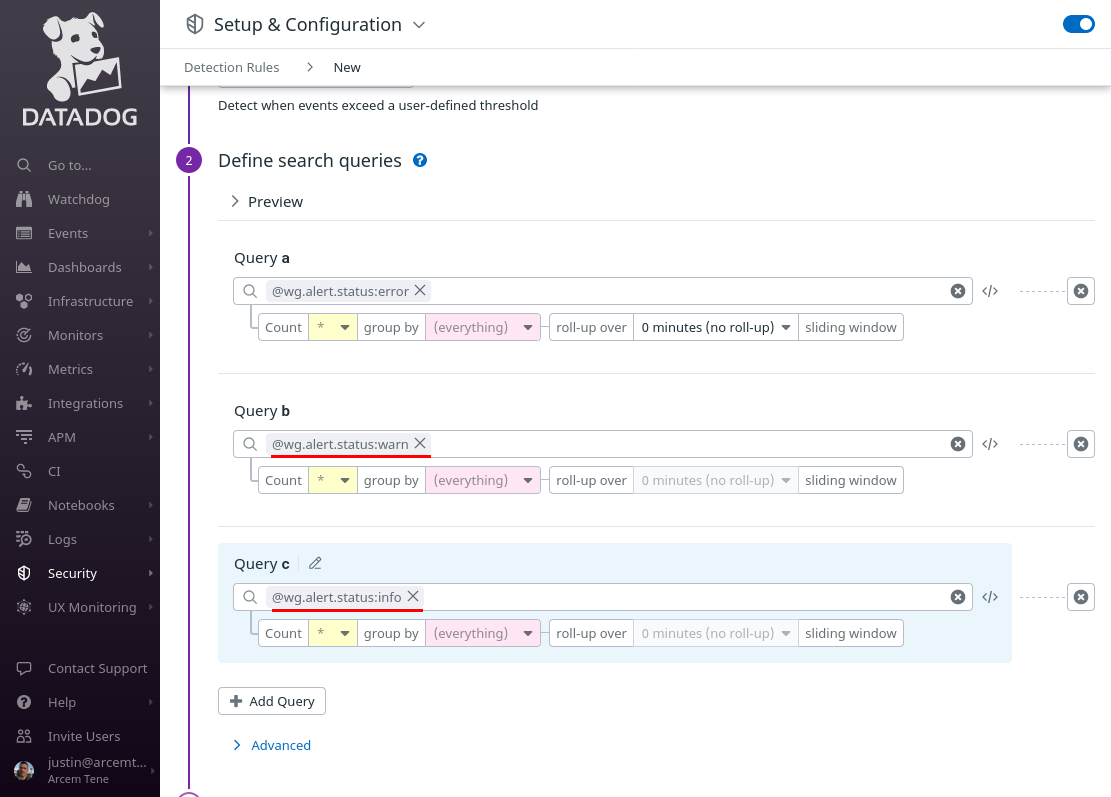
Scroll down to the Query a field, and enter @wg.alert.status:error into it. Set its roll-up over setting to 0 minutes (no roll-up) — we want to generate a separate Datadog security signal for each individual Pro Custodibus alert. Then click the Add Query button:
In the added Query b field, enter @wg.alert.status:warn into it; then click the Add Query button again. In the added Query c field, enter @wg.alert.status:info:
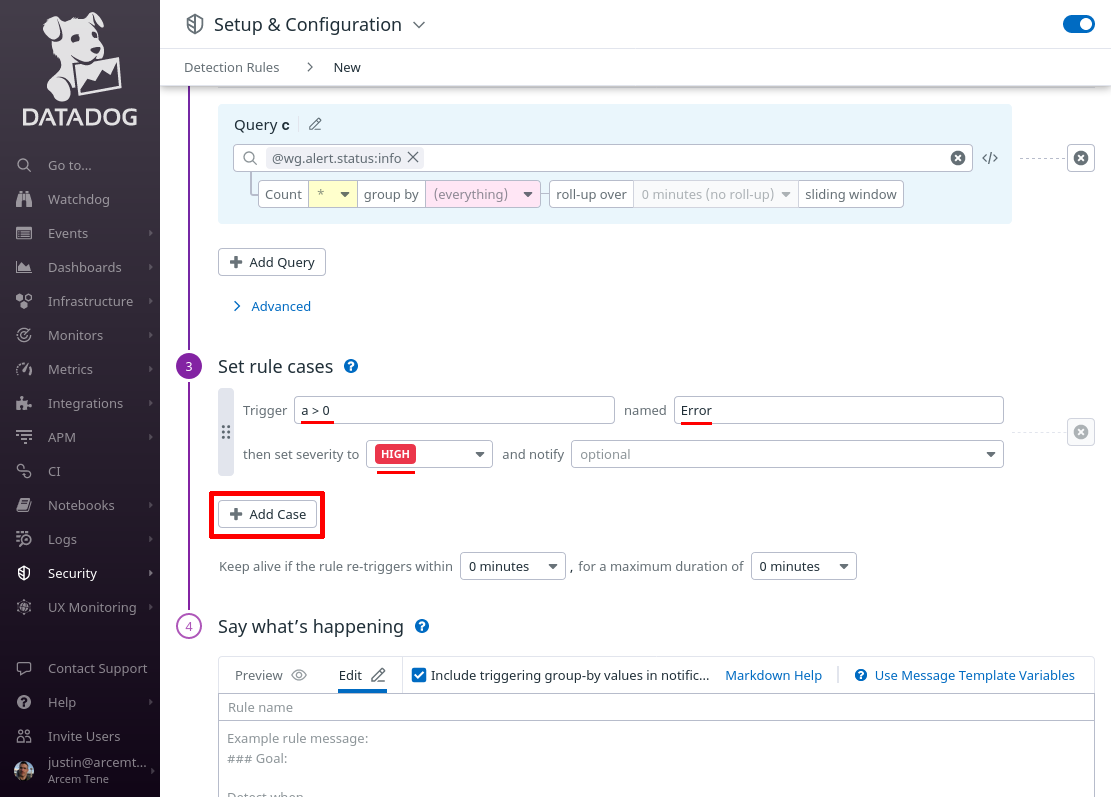
Scroll down to the “Set rule cases” section, and in the Trigger field, enter a > 0 into it; in the named field, enter Error; in the then set severity to, select HIGH; then click the Add Case button:
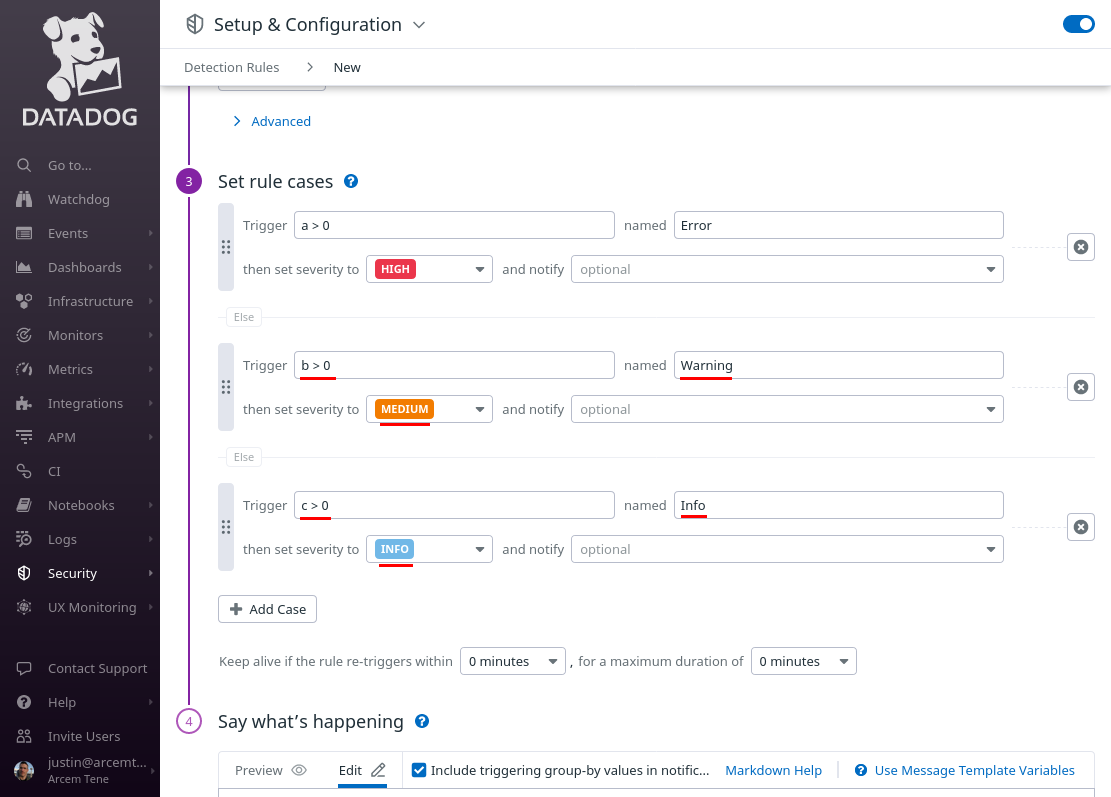
In the next Trigger field, enter b > 0; in its corresponding named field, enter Warning; and in its corresponding then set severity to, select MEDIUM; then click the Add Case button again.
In the next Trigger field, enter c > 0; in its named field, enter Info; and in its then set severity to, select INFO:
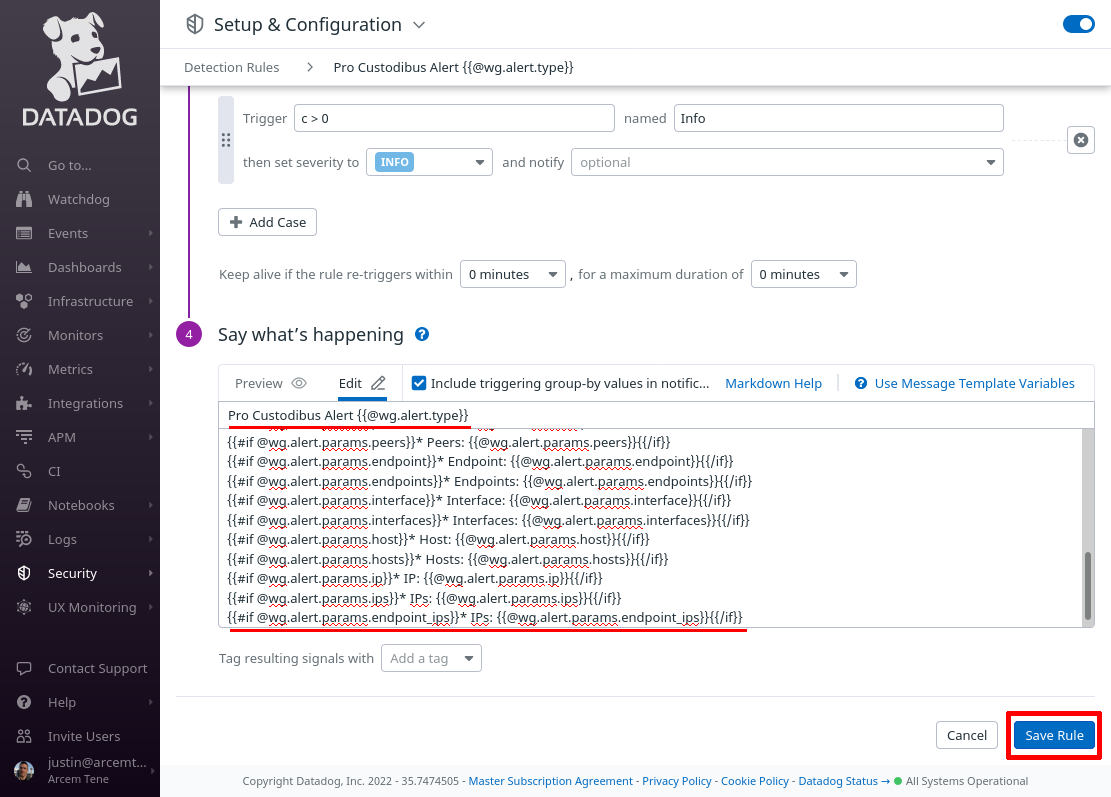
Scroll down to the “Say what’s happening” section, and in the Rule name field, enter Pro Custodibus Alert {{@wg.alert.type}}. In the Rule message field, enter text like the following:
## Goal
Detect Pro Custodibus alerts.

## Strategy
Check for alerts at error, warn, and info levels.

## Triage & Response
1. Check alert type & parameters.
2. Diagnose issue and respond appropriately.

## Alert for {{@wg.alert.type}}

{{#if @wg.alert.params.peer}}* Peer: {{@wg.alert.params.peer}}{{/if}}
{{#if @wg.alert.params.peers}}* Peers: {{@wg.alert.params.peers}}{{/if}}
{{#if @wg.alert.params.endpoint}}* Endpoint: {{@wg.alert.params.endpoint}}{{/if}}
{{#if @wg.alert.params.endpoints}}* Endpoints: {{@wg.alert.params.endpoints}}{{/if}}
{{#if @wg.alert.params.interface}}* Interface: {{@wg.alert.params.interface}}{{/if}}
{{#if @wg.alert.params.interfaces}}* Interfaces: {{@wg.alert.params.interfaces}}{{/if}}
{{#if @wg.alert.params.host}}* Host: {{@wg.alert.params.host}}{{/if}}
{{#if @wg.alert.params.hosts}}* Hosts: {{@wg.alert.params.hosts}}{{/if}}
{{#if @wg.alert.params.ip}}* IP: {{@wg.alert.params.ip}}{{/if}}
{{#if @wg.alert.params.ips}}* IPs: {{@wg.alert.params.ips}}{{/if}}
{{#if @wg.alert.params.endpoint_ips}}* IPs: {{@wg.alert.params.endpoint_ips}}{{/if}}
This will display the most common Pro Custodibus alert parameters (when a particular parameter is included in an alert).
Finally, click the Save Rule button:
Once Pro Custodibus has generates some alerts, you’ll see them on the Datadog Security Signals page:
Endpoint Stats
Pro Custodibus keeps track of which WireGuard peers connect to a monitored host, and how much data is sent to and from each. You can configure Pro Custodibus to send this information to Datadog through “endpoint stats” log entries (with one record for the data transferred by an individual peer connection over a two-minute period).
Follow these steps to connect Pro Custodibus’ endpoint stats to Datadog:
Set Up Pro Custodibus Webhooks for Endpoint Stats
To set up the Pro Custodibus webhook that will push endpoint stats to Datadog, log into the Pro Custodibus app, and navigate to the Admin area of the app; then click the Webhooks link:
Click the Add icon on the top-right corner of the Webhooks panel:
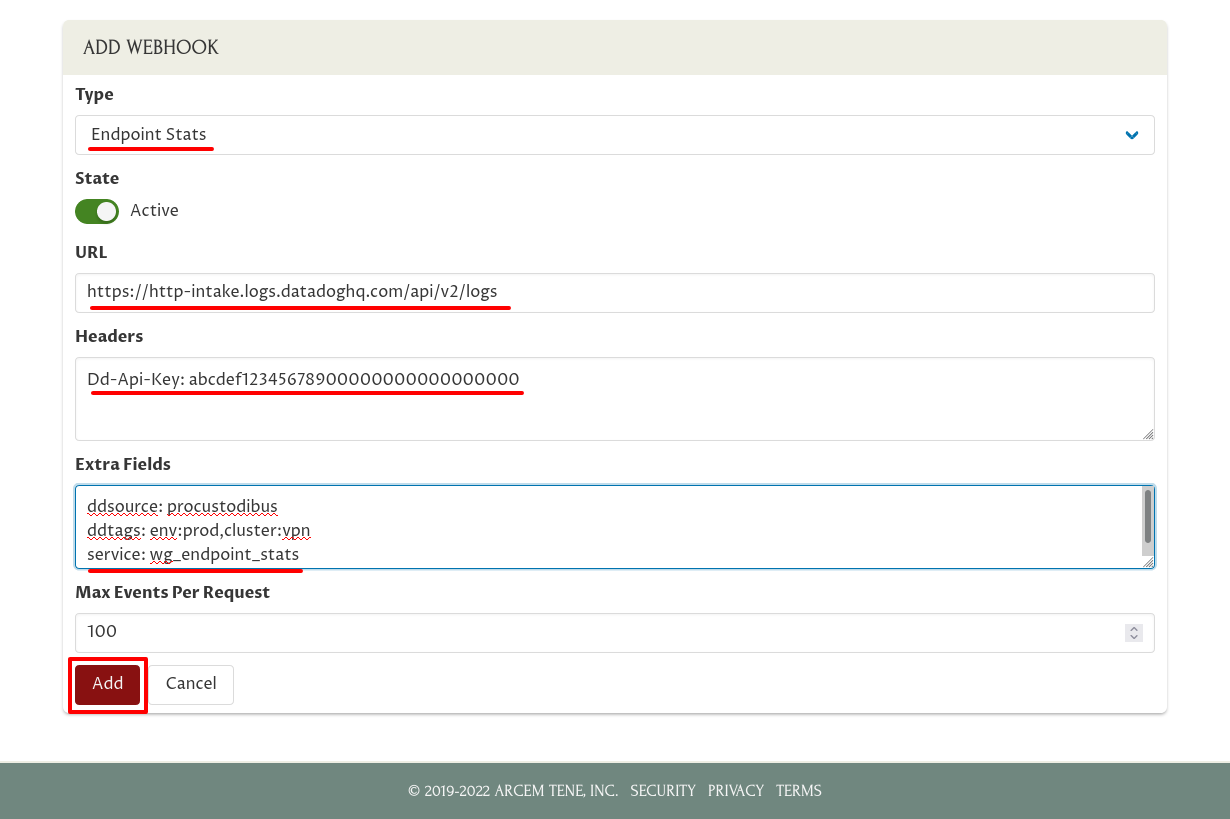
For the Type field, select Endpoint Stats. For URL, enter https://http-intake.logs.datadoghq.com/api/v2/logs. For Headers, enter Dd-Api-Key: followed by your Datadog API Key. For Extra Fields, enter ddsource: procustodibus on one line, any tags you want on another line (in this example, ddtags: env:prod,cluster:vpn), and service: wg_endpoint_stats on the last line. Then click the Add button:
|
Note
|
For Datadog sites other than |
Set Up Datadog Log Pipeline for Endpoint Stats
Next, we’ll set up a Datadog log-management pipeline to map the endpoint-stats attributes that Pro Custodibus emits into attributes that better fit Datadog’s built-in functionality.
Log into the Datadog app, and navigate to the Configuration section of the Logs area of the app:
Click the New Pipeline button:
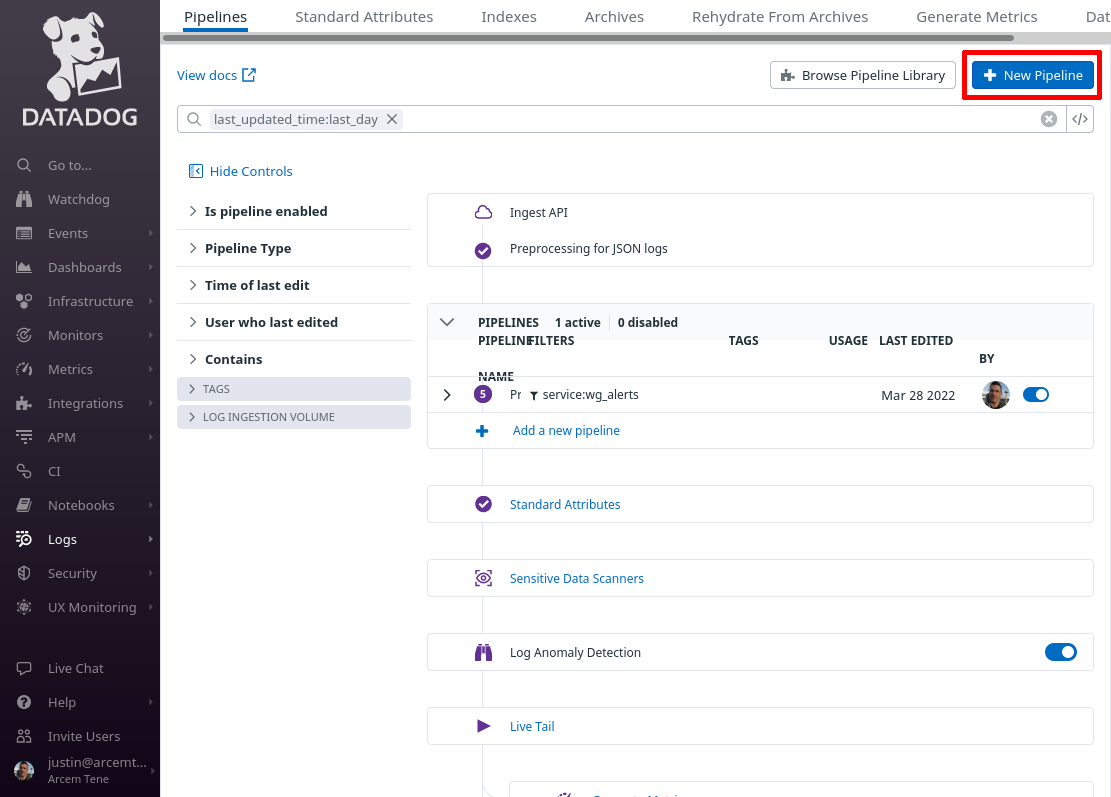
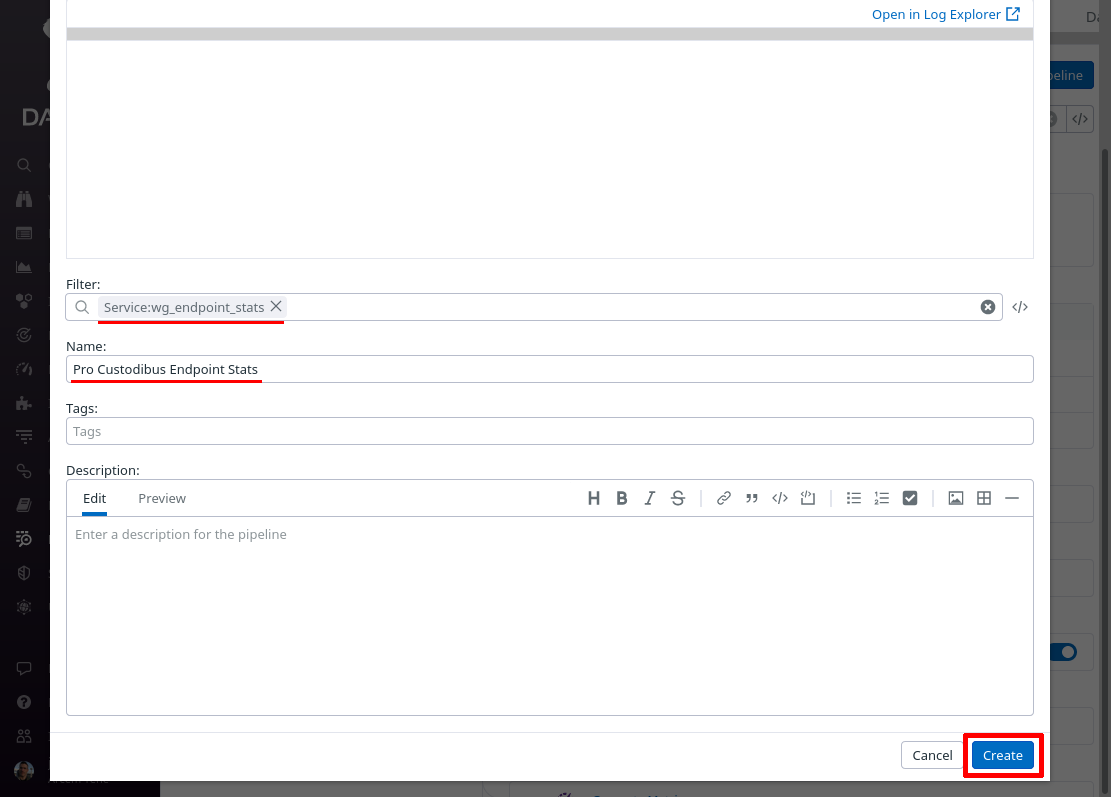
In the Filter field of the “Create Pipeline” dialog, enter service:wg_endpoint_stats — since this filter matches the “service” setting from the Pro Custodibus webhook “Extra Fields” settings above, this pipeline will process only logs pushed from that webhook. In the Name field, enter a useful display name, like “Pro Custodibus Endpoint Stats”. Then click the Create button:
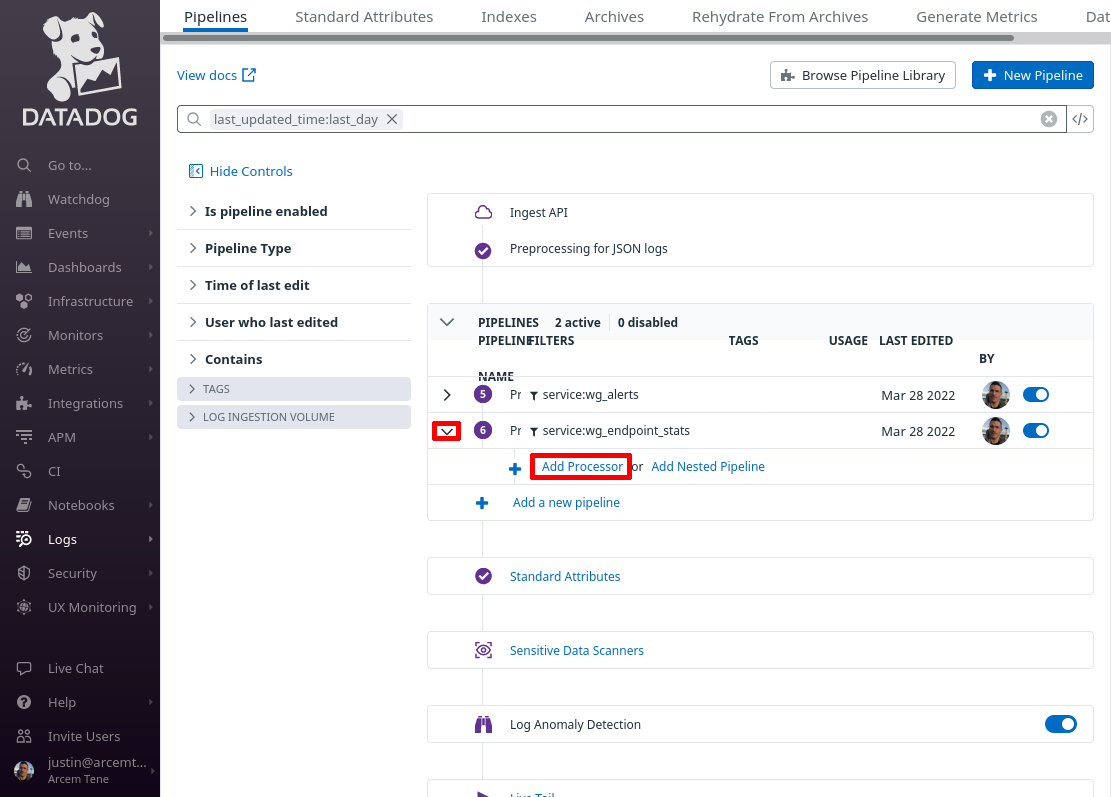
Toggle the expand button for the new pipeline, and then click the Add Processor link:
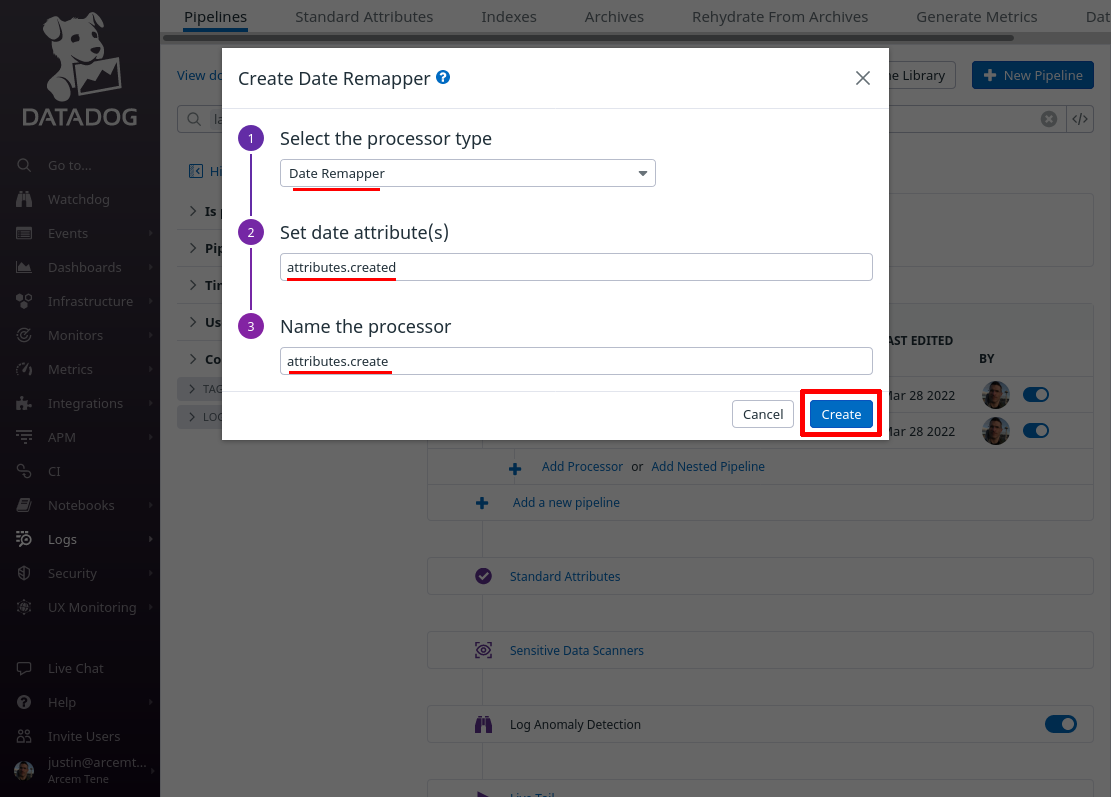
In the Select the processor type field, select Date Remapper. For the Set date attribute(s) field, enter attributes.created — this is the field Pro Custodibus uses to indicate the stat’s date. For the Name the processor field, enter a useful display name, like “attributes.created”. Then click the Create button:
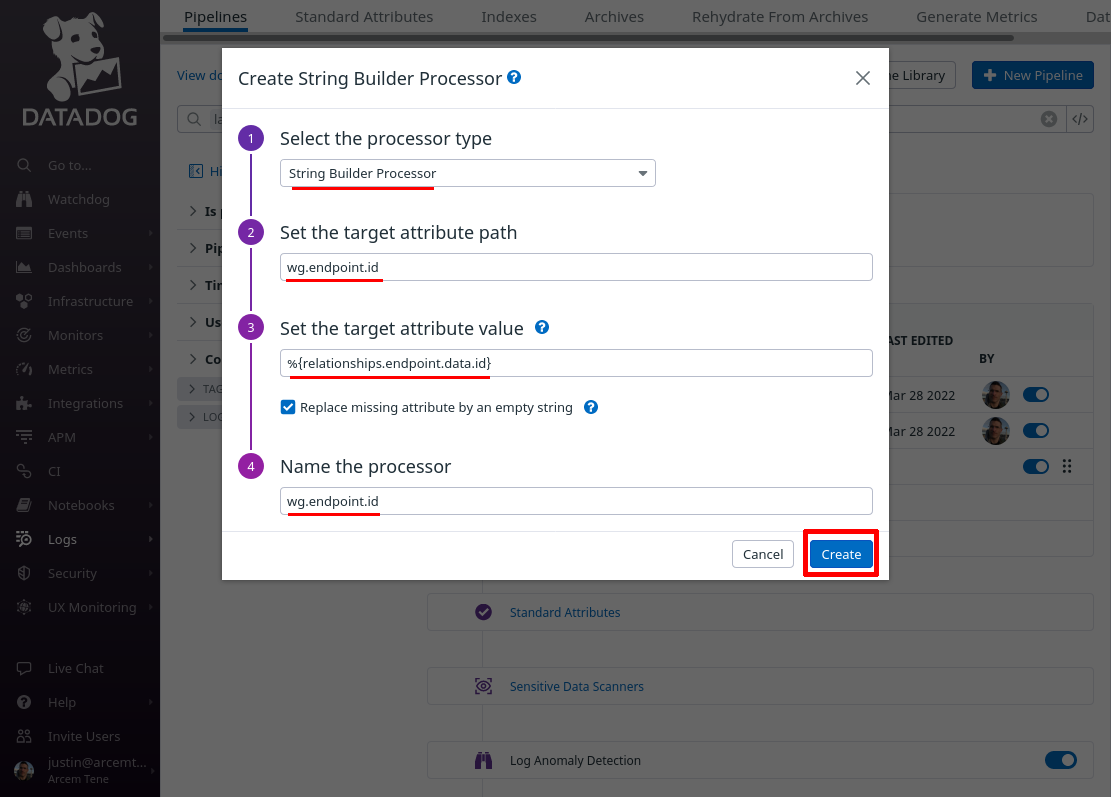
Now click the Add Processor link again; this time we’ll create a mapping from the field that identifies the specific WireGuard endpoint to which the stat pertains to a custom Datadog attribute field. We have to do this in a round-about way, with a “String Builder Processor” instead of a simple “Remapper”, because the Pro Custodibus ID for the endpoint is sent inside of an array.
So for the Select processor type field, select String Builder Processor. For the Set target attribute path field, enter wg.endpoint.id (this is the name of the new Datadog attribute we’ll create). For the Set the target attribute value field, enter %{relationships.endpoint.data.id} (an expression that resolves to the Pro Custodibus ID for the endpoint). For the Name the processor field, enter a useful display name, like “wg.endpoint.id”. Then click the Create button:
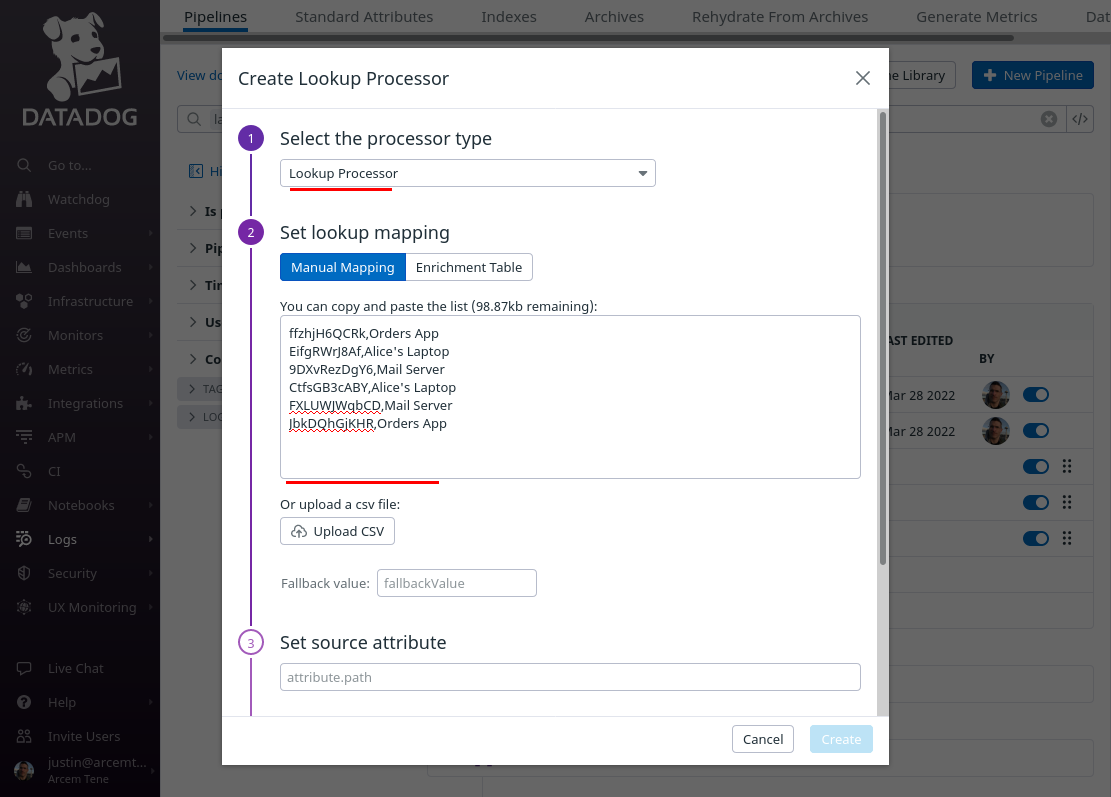
Click the Add Processor link again; now we’ll add a lookup mapping from the Datadog wg.endpoint.id attribute we just created to a display name for the monitored WireGuard host to which the endpoint connects.
For the Select processor type field, select Lookup Processor. For the Set lookup mapping field, enter a CSV list of values like the following (for an example environment), which maps a Pro Custodibus endpoint ID in the first column to the name of a monitored host in the second column:

|
Tip
|
You can compile a list of mappings for your own environment by navigating to each endpoint in Pro Custodibus, and copying its ID. With our example environment, this Pro Custodibus page shows that for the “Mail Server” host, 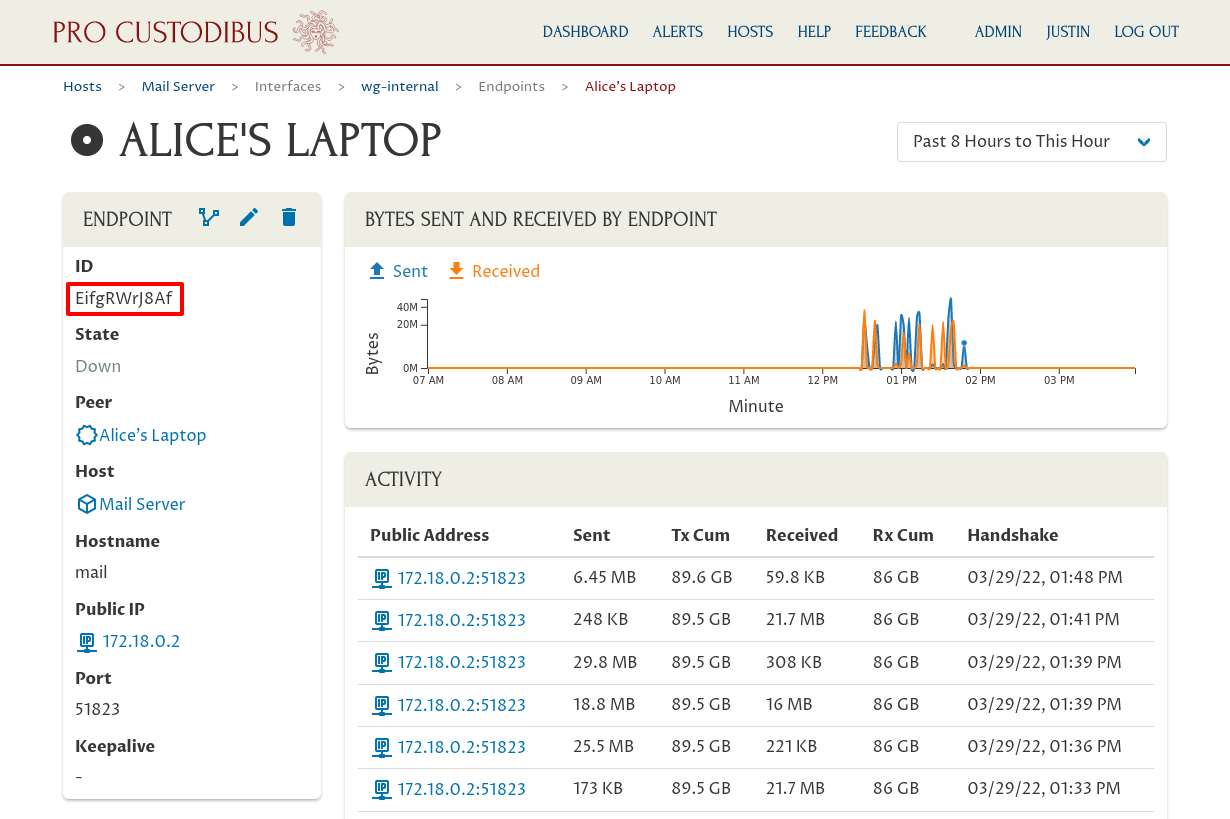
|
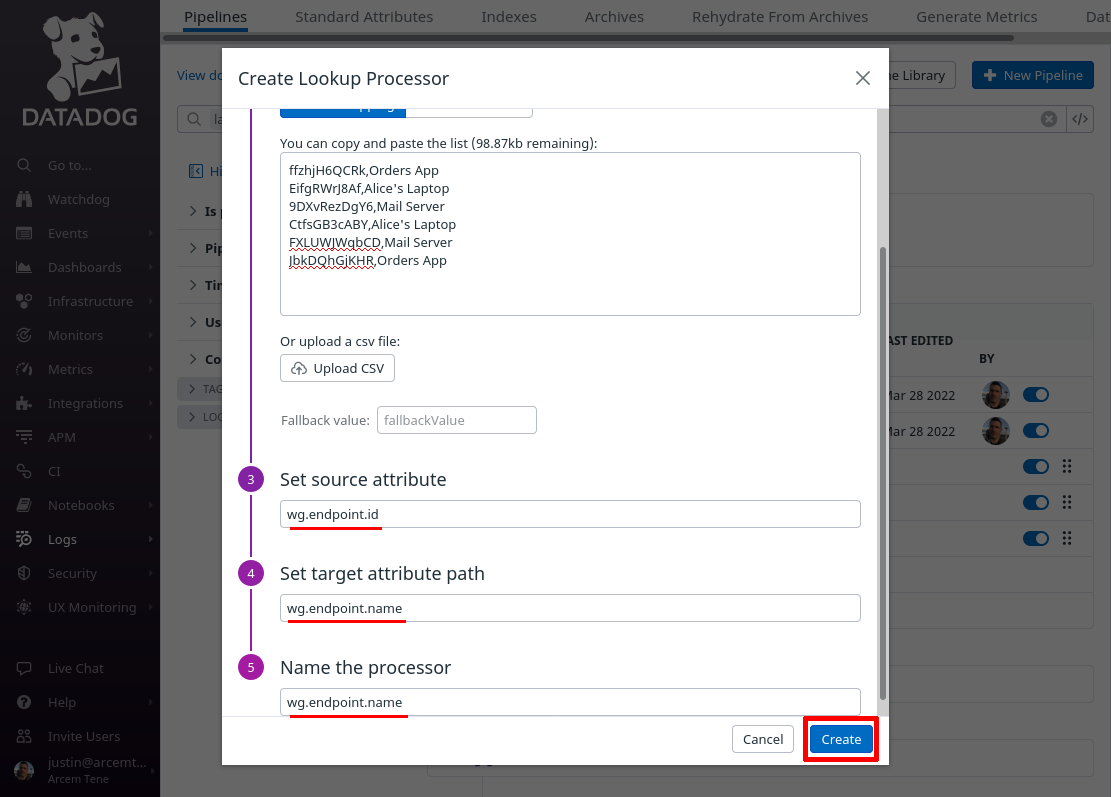
In the “Create Lookup Processor” dialog, scroll down, and for the Set source attribute field, enter wg.endpoint.id (the first column in the CSV list will match this attribute value). For the Set target attribute path field, enter wg.host.name (this is the name of the new Datadog attribute we’ll create, using the values from the second column). For the Name the processor field, enter a useful display name like “wg.host.name”. Then click the Create button:
Click the Add Processor link again; now we’ll add another lookup mapping from the Datadog wg.endpoint.id attribute — but this time to a display name for the endpoint itself (the “remote” side of the connection).
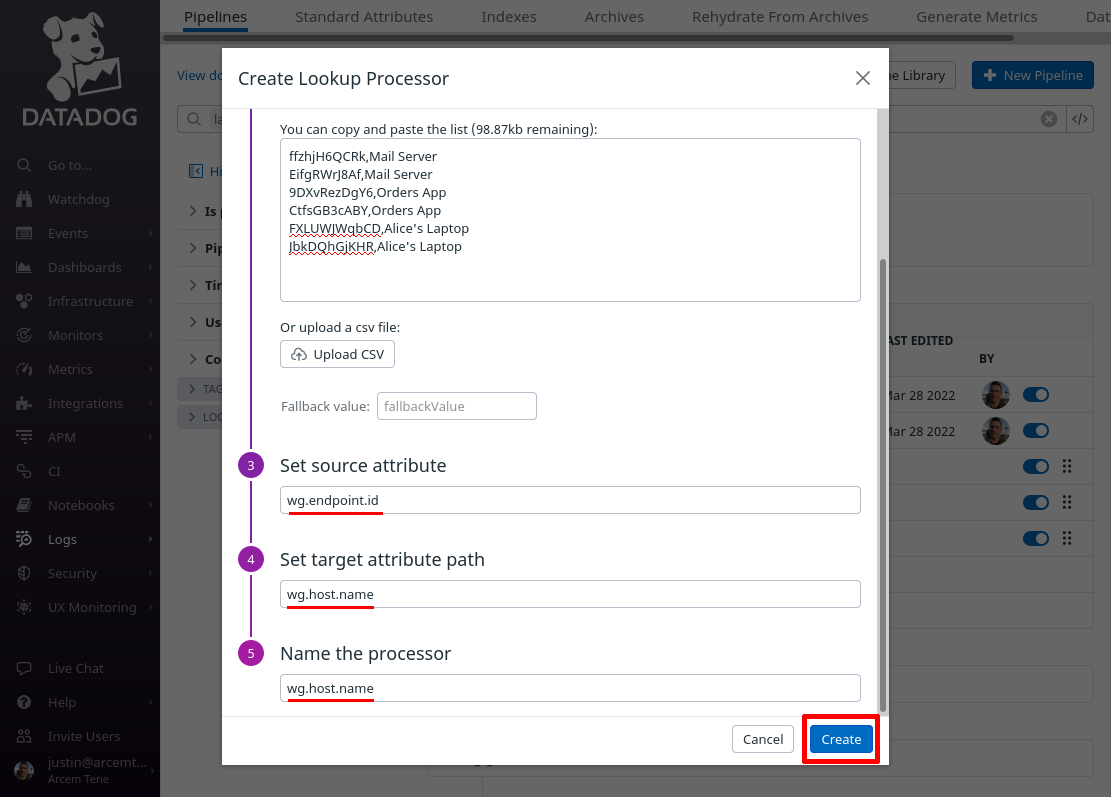
For the Select processor type field, select Lookup Processor again. For the Set lookup mapping field, enter another CSV list of values — but this time a list which maps a Pro Custodibus endpoint ID (in the first column) to the name of the endpoint itself (in the second column):
Scroll down, and for the Set source attribute field, enter wg.endpoint.id (the first column in the CSV list will match this attribute value). For the Set target attribute path field, enter wg.endpoint.name (this is the name of the new Datadog attribute we’ll create from the values in the second column). For the Name the processor field, enter a useful display name like “wg.endpoint.name”. Then click the Create button:
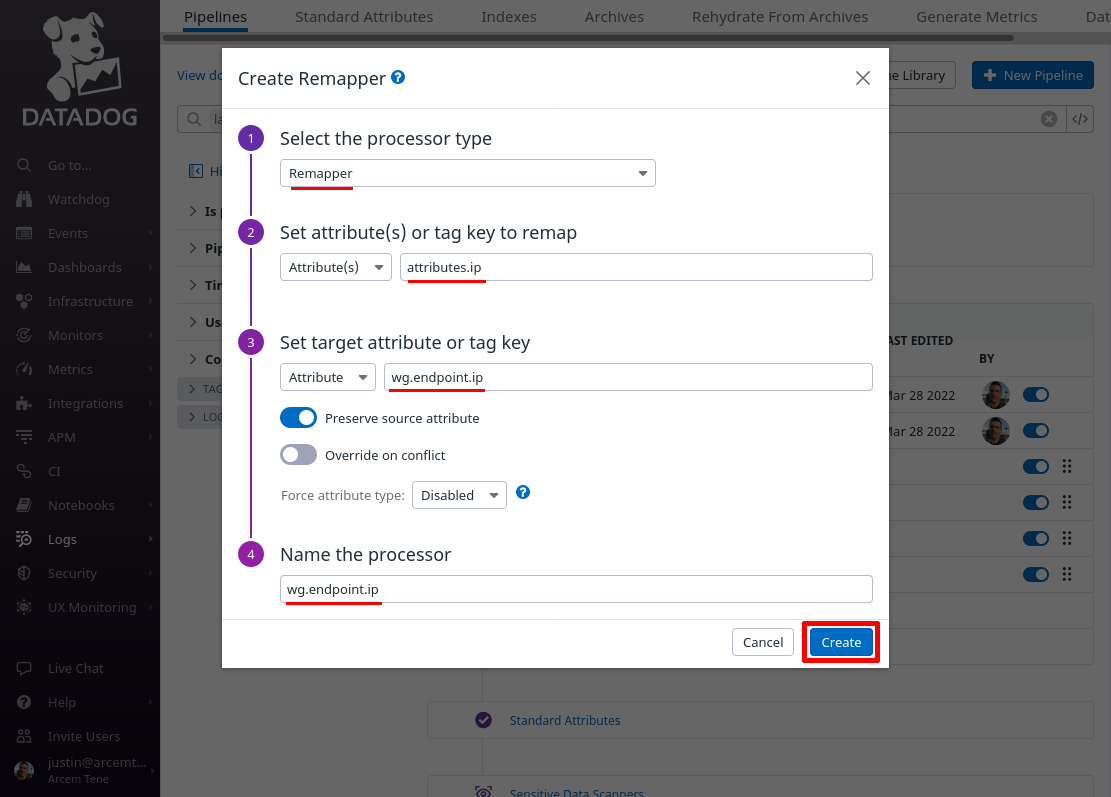
Click the Add Processor link again; this time we’ll map the attribute Pro Custodibus uses for the endpoint’s IP address to a new custom Datadog attribute, for our own convenience.
For the Select processor type field, select Remapper. For the Set attribute(s) or tag key to remap field, enter attributes.ip (this is the name of the attribute Pro Custodibus uses for endpoint IP address).
For the Set target attribute or tag key field, enter wg.endpoint.ip (this is the name of the new Datadog attribute we’ll create; if you already have a standard attribute you use for event source IP addresses, such as network.client.ip, you may want to use that attribute here instead). For the Name the processor field, enter a useful display name like “wg.endpoint.ip”. Then click the Create button:
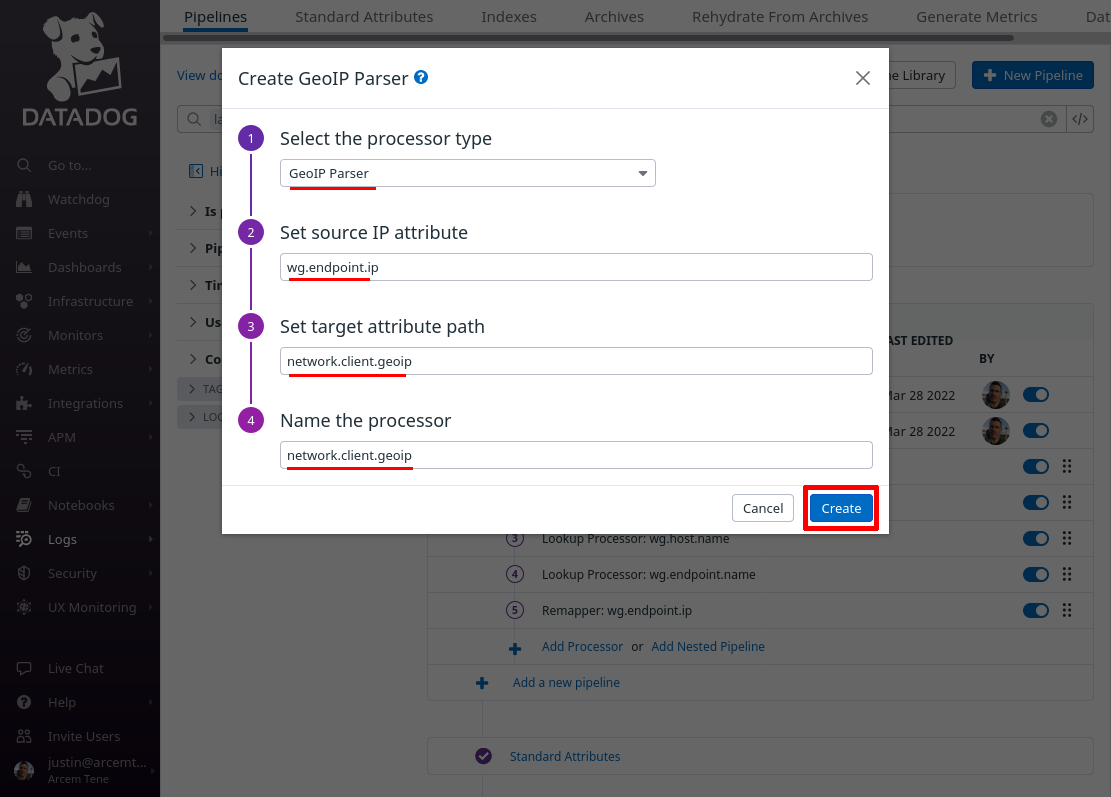
Click the Add Processor link one more time; lastly we’ll look up the endpoint’s IP address in Datadog’s geoip database.
For the Select processor type field, select GeoIP Parser. For the Set source IP attribute, enter wg.endpoint.ip (the name of the Datadog attribute we set up with the previous processor above).
For the Set target attribute path field, enter network.client.geoip (so that we can use this with Datadog’s “impossible travel” security detection rules later). For the Name the processor field, enter a useful display name like “network.client.geoip”. Then click the Create button:
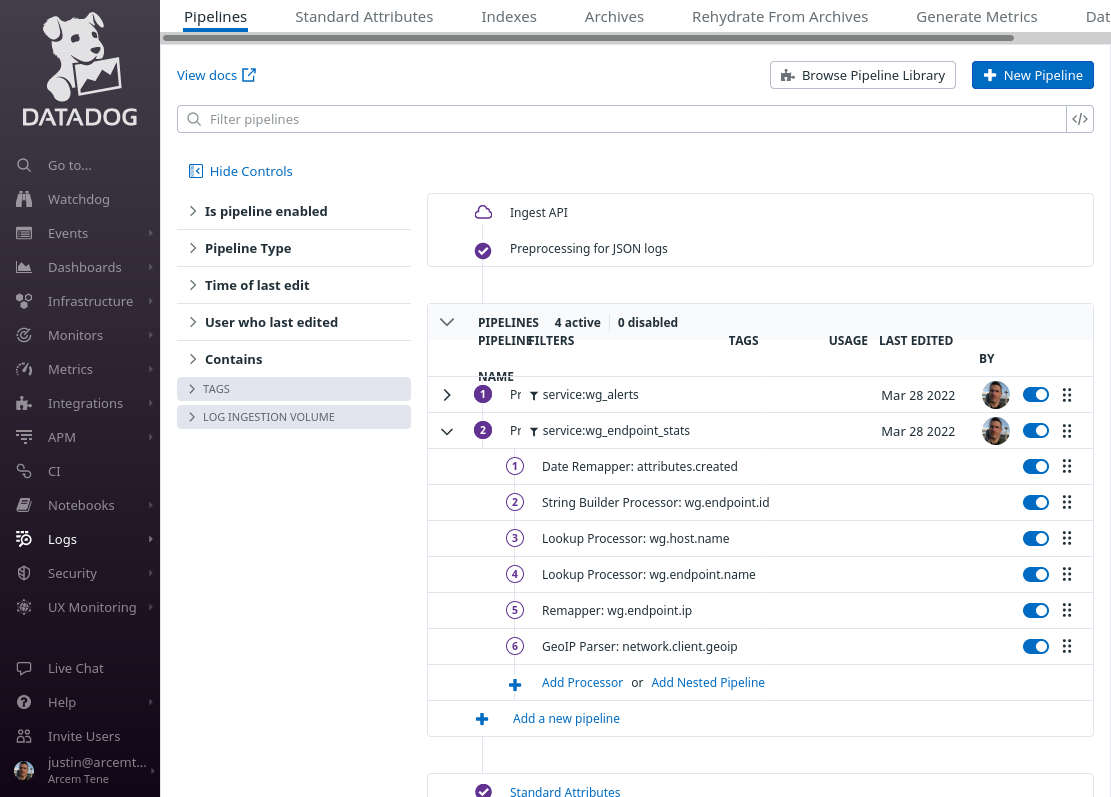
At the end of this process, your endpoint-stats pipeline should look like the following:
Set Up Datadog Log Explorer for Endpoint Stats
Next, we’ll set up the Datadog log explorer with some useful log facets and a custom view to show our new WireGuard endpoint stats.
In the Datadog app, navigate to the Search section of the Logs area of the app:
In the facets pane on the right side of the log search page, click the Add button:
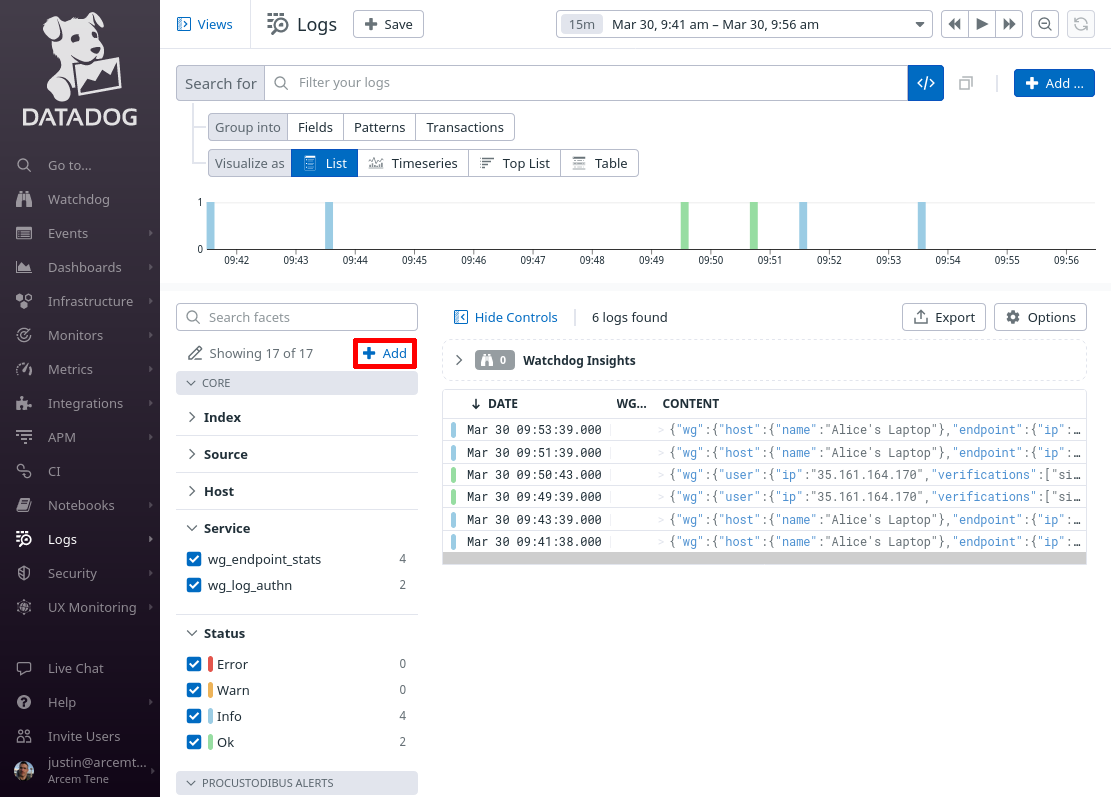
On the “Add facet” dialog, in the Path field, enter @wg.endpoint.ip (or whatever Datadog attribute you remapped from the source Pro Custodibus attributes.ip attribute in the previous section). For the Group field, enter Procustodibus (or the name of some custom group that you’d rather use). Then click the Add button:
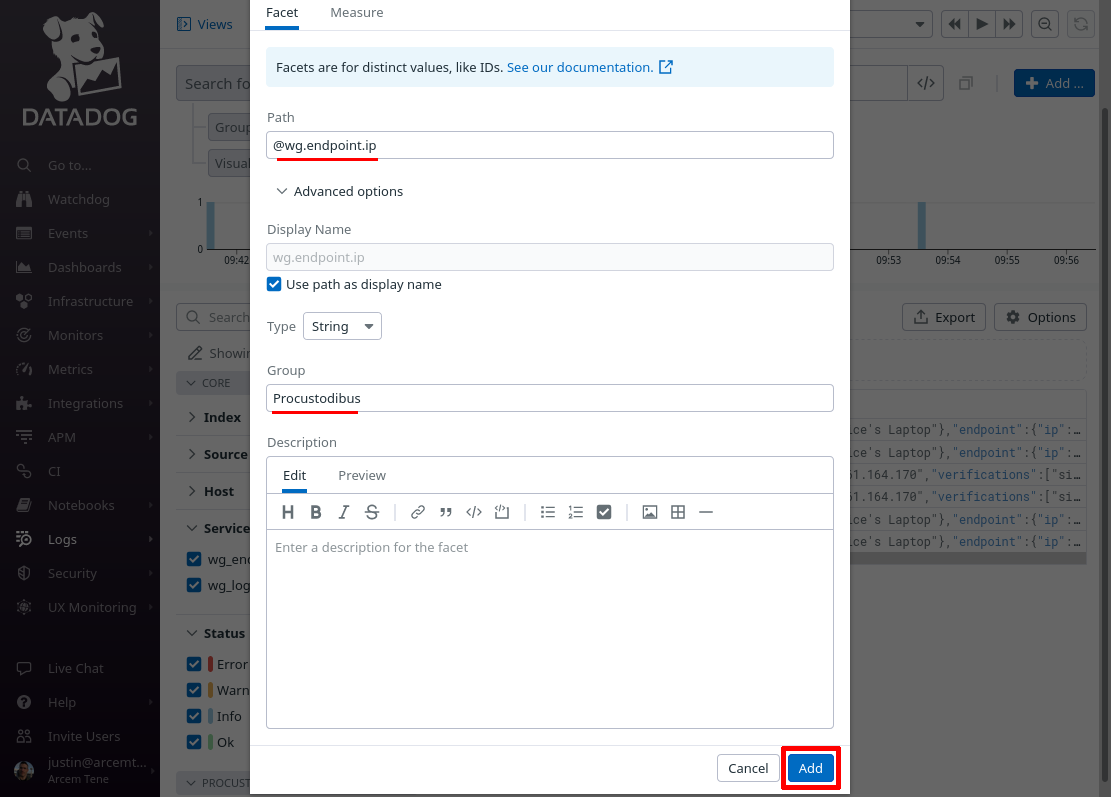
Do the same for these other attributes that we set up in the previous section:
-
wg.endpoint.name -
wg.host.name
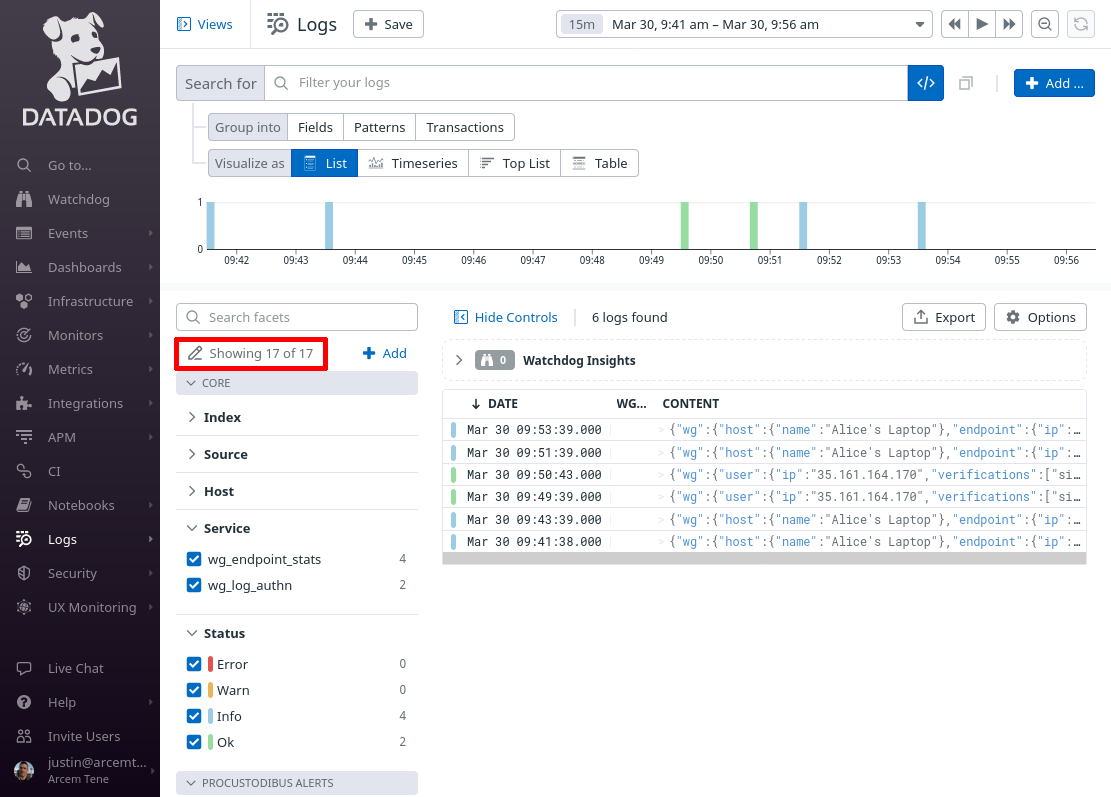
When done, click the Showing X of Y link in the facets pane:
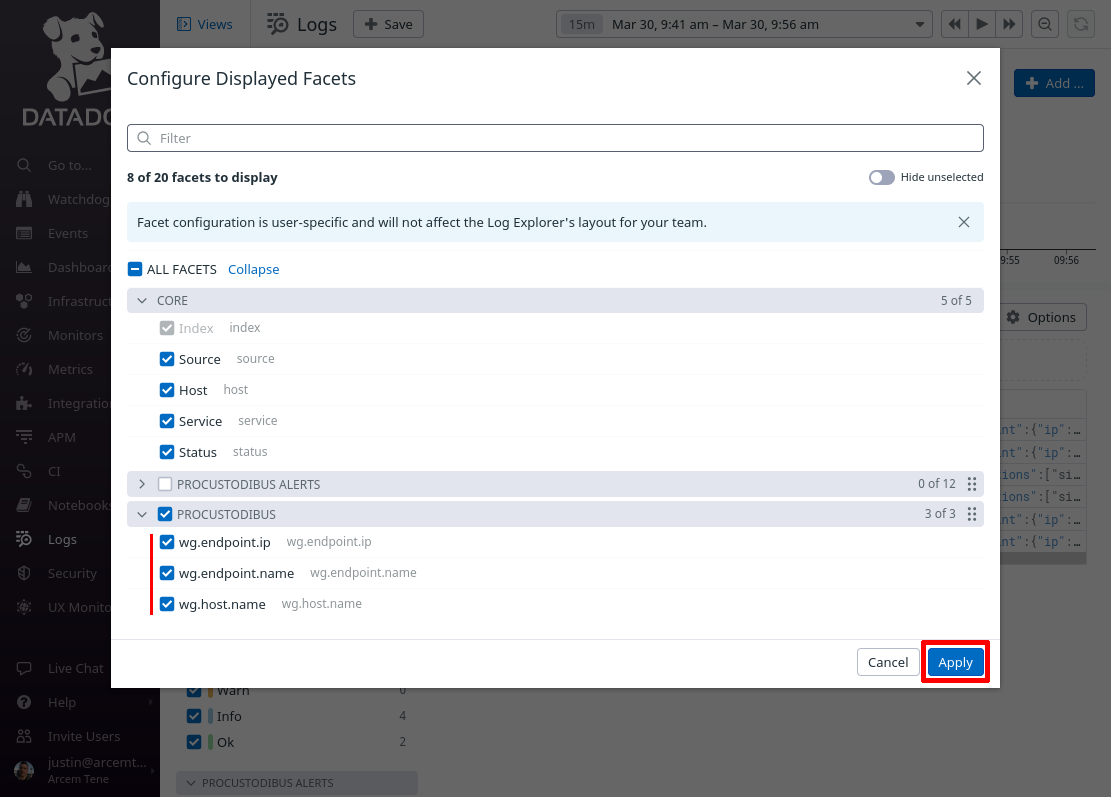
Select all the facets you just added, so that you can see them in the facets pane of the main log explorer page, and click the Apply button:
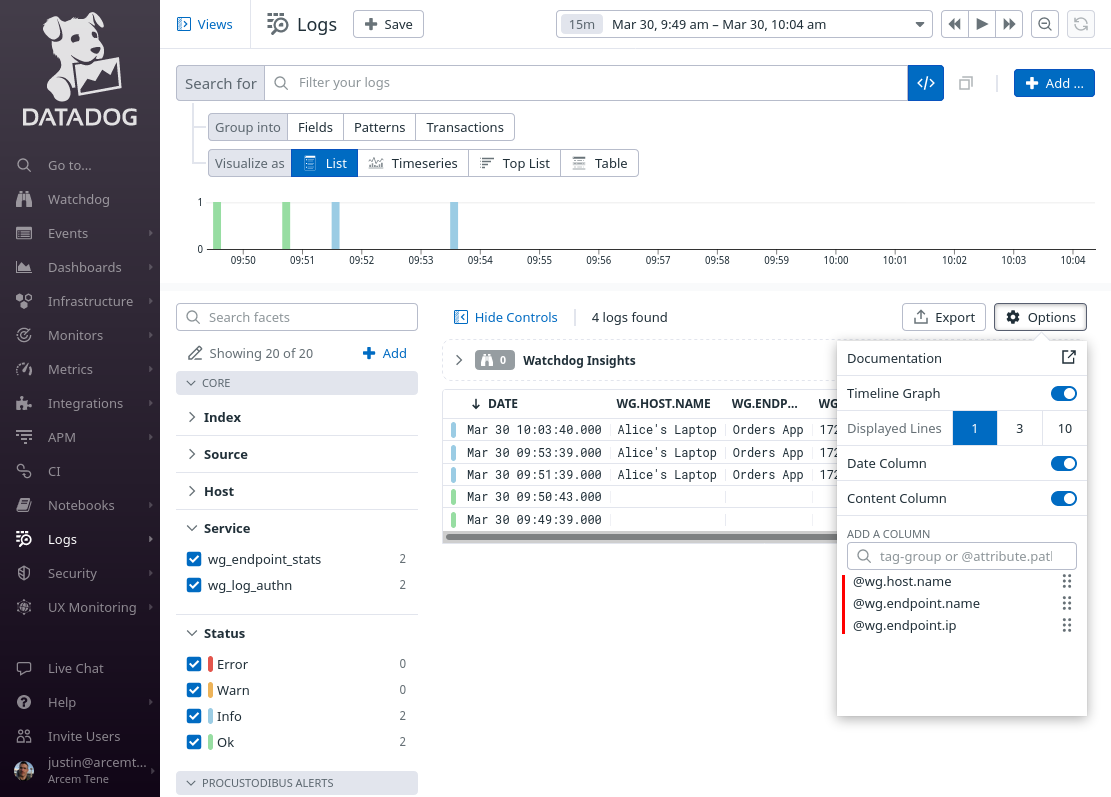
Then click the Options button above the list of log entries to customize the columns displayed in the list:
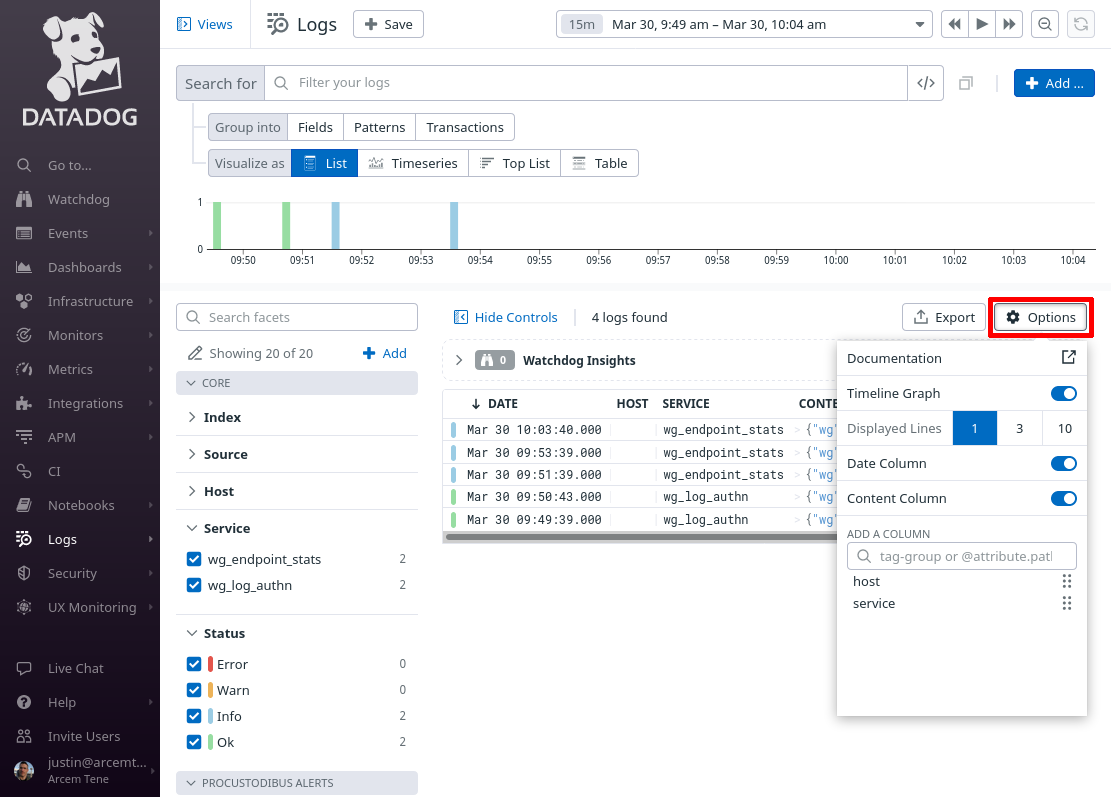
Remove the existing columns (other than Date and Content), and add the following columns:
-
wg.host.name -
wg.endpoint.name -
wg.endpoint.ip
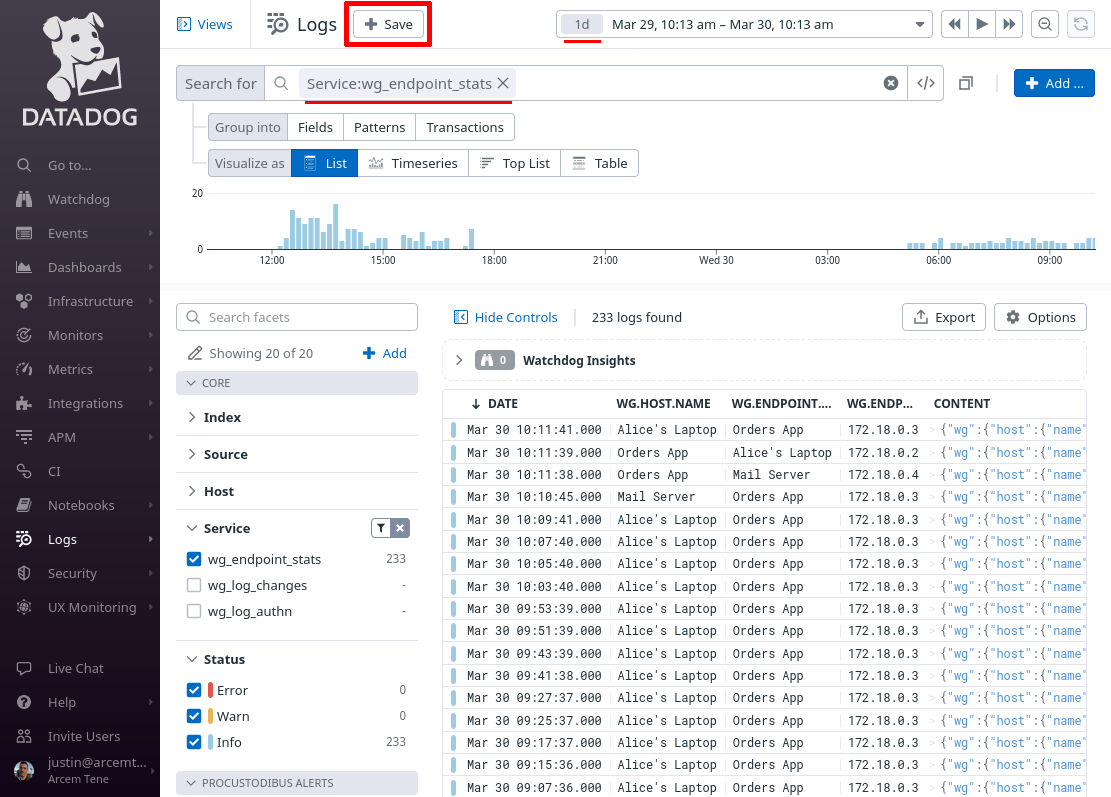
Change the Search for field to service:wg_endpoint_stats, and the time range to the past day (or past week). Then click the Save button:
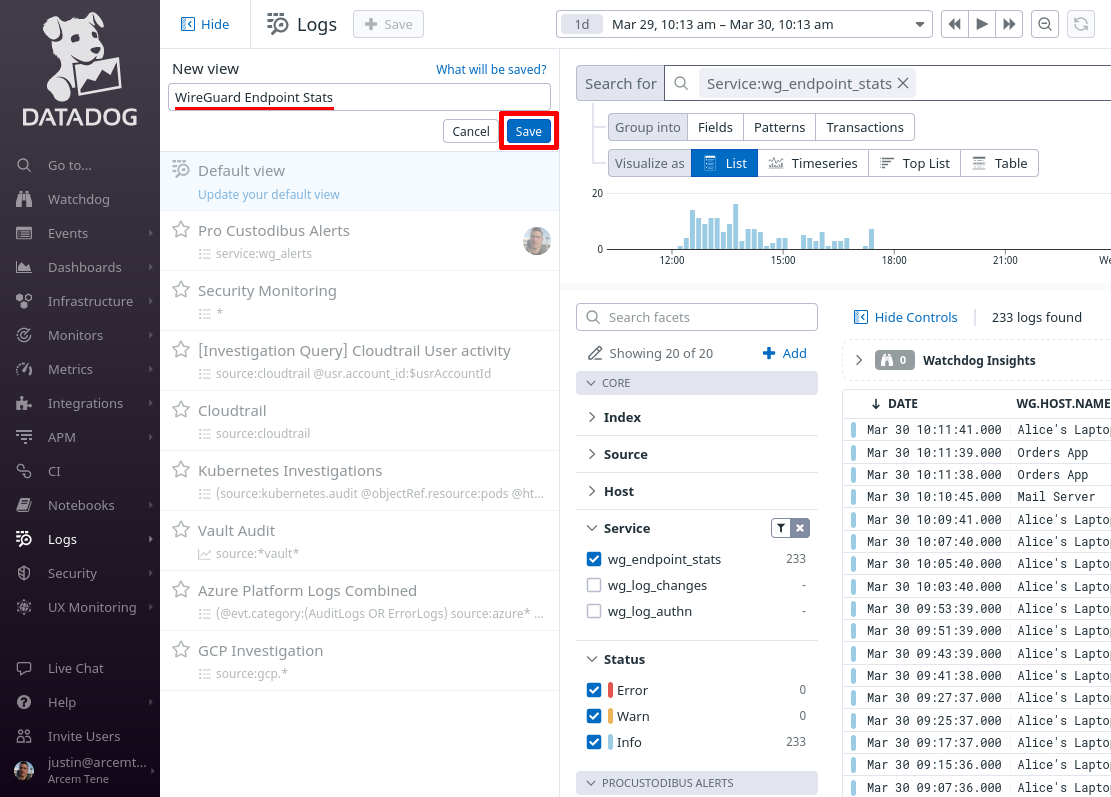
In the New view field, enter WireGuard Endpoint Stats, and click the Save button:
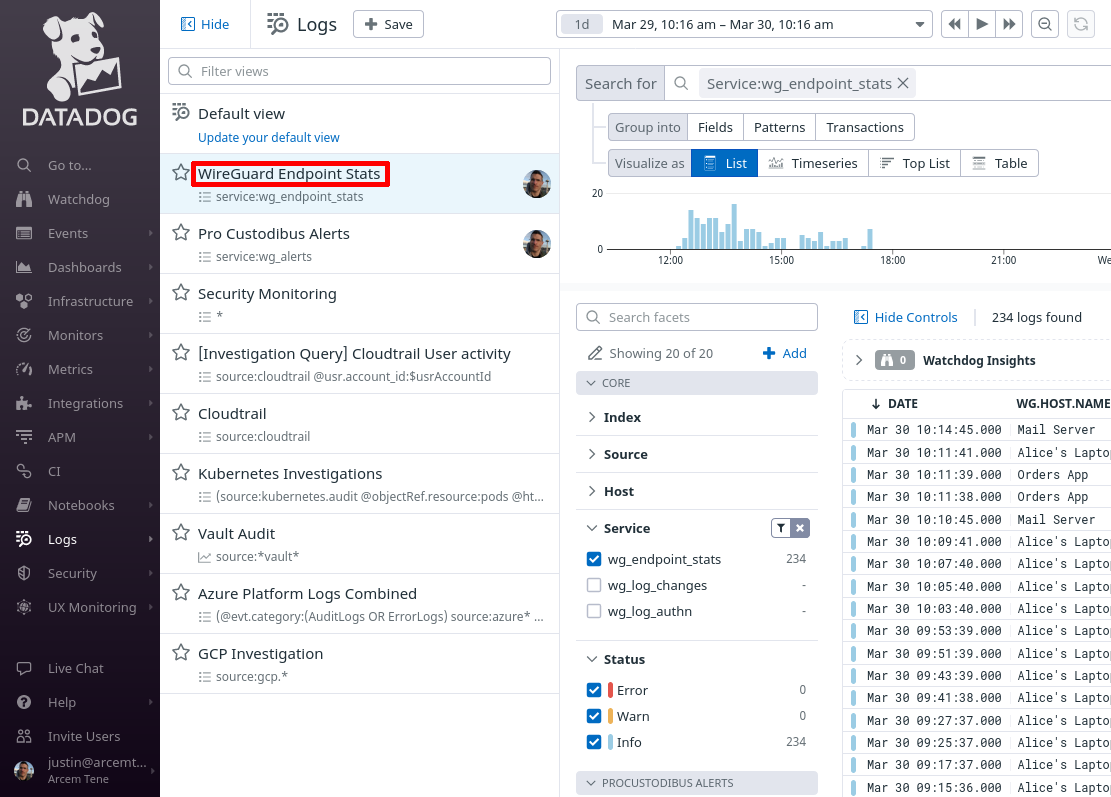
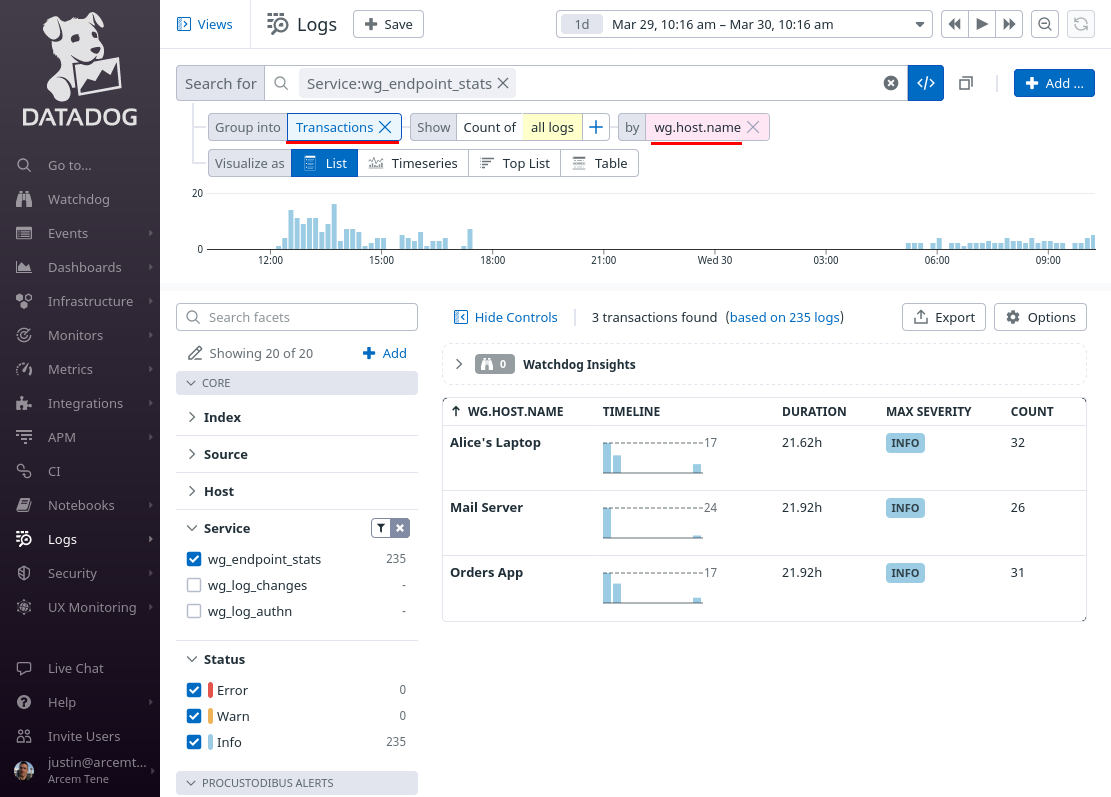
You can return to this view later to when you want to check on your WireGuard endpoint stats:
And you can use Datadog’s search and visualization tools to further filter these stats to identify WireGuard usage patterns, such as to group connections by the monitored host to which WireGuard endpoints have connected:
Set Up Datadog Security Detection Rules for Endpoint Stats
Finally, we’ll set up Datadog’s Cloud SIEM with our first custom detection rule for WireGuard endpoint stats. We’ll take advantage of Datdog’s new “Impossible Travel” detection method to set up a rule that detects when the same WireGuard identity is used to access the same monitored host from two different physical locations within a time period that would be too short to travel between.
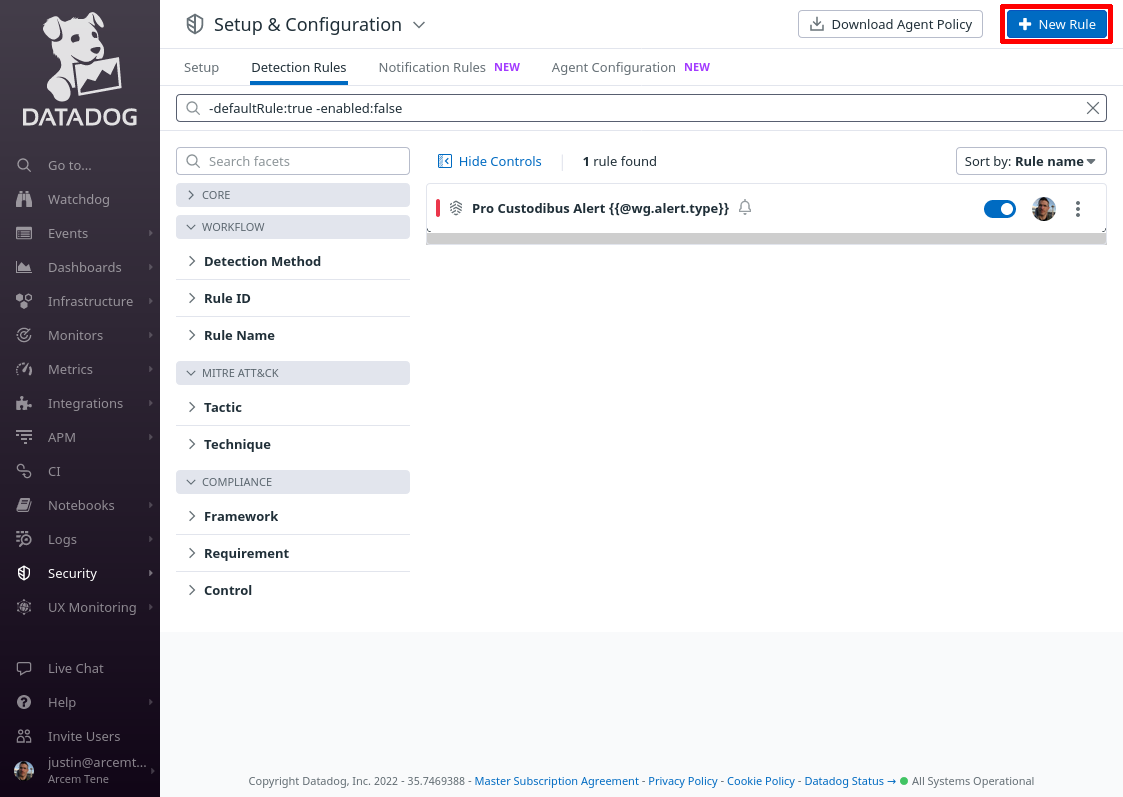
In the Datadog app, navigate to the Detection Rules section of the Security area of the app:
Click the New Rule button:
For Detection rule types, select Log Detection, and for Detection methods, select Impossible Travel.
Then for Define search queries, enter service:wg_endpoint_stats, and for User attribute, enter wg.endpoint.name:
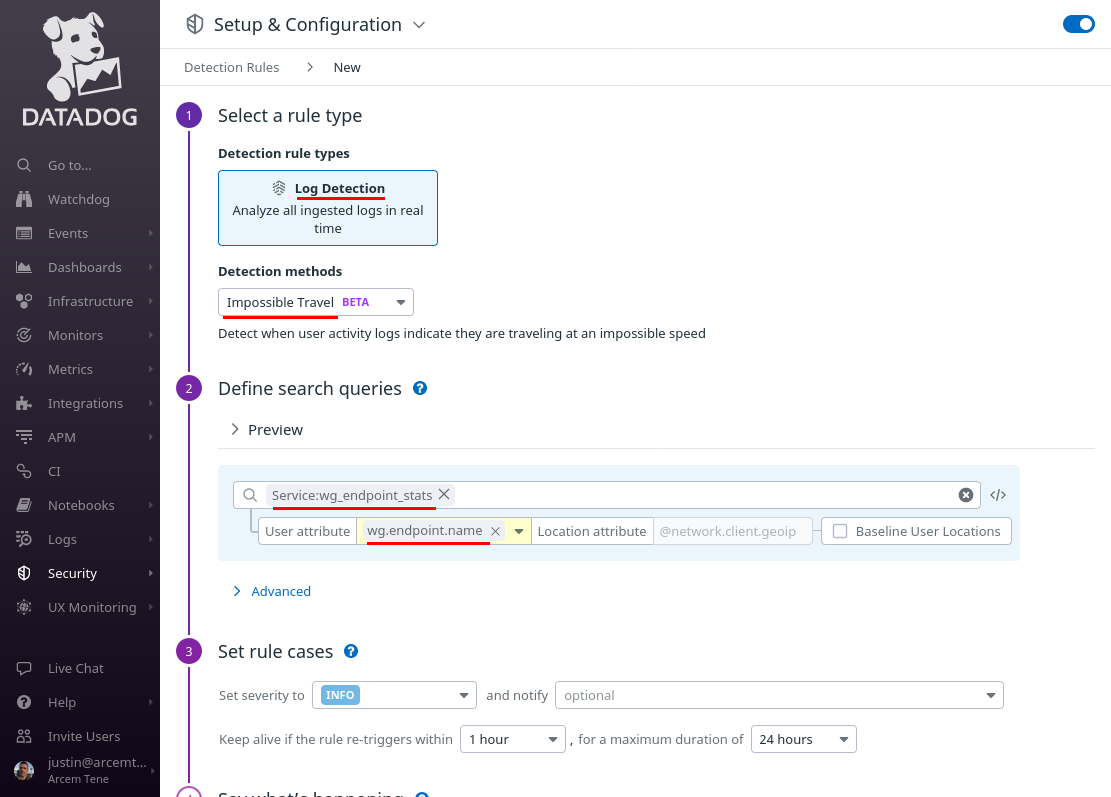
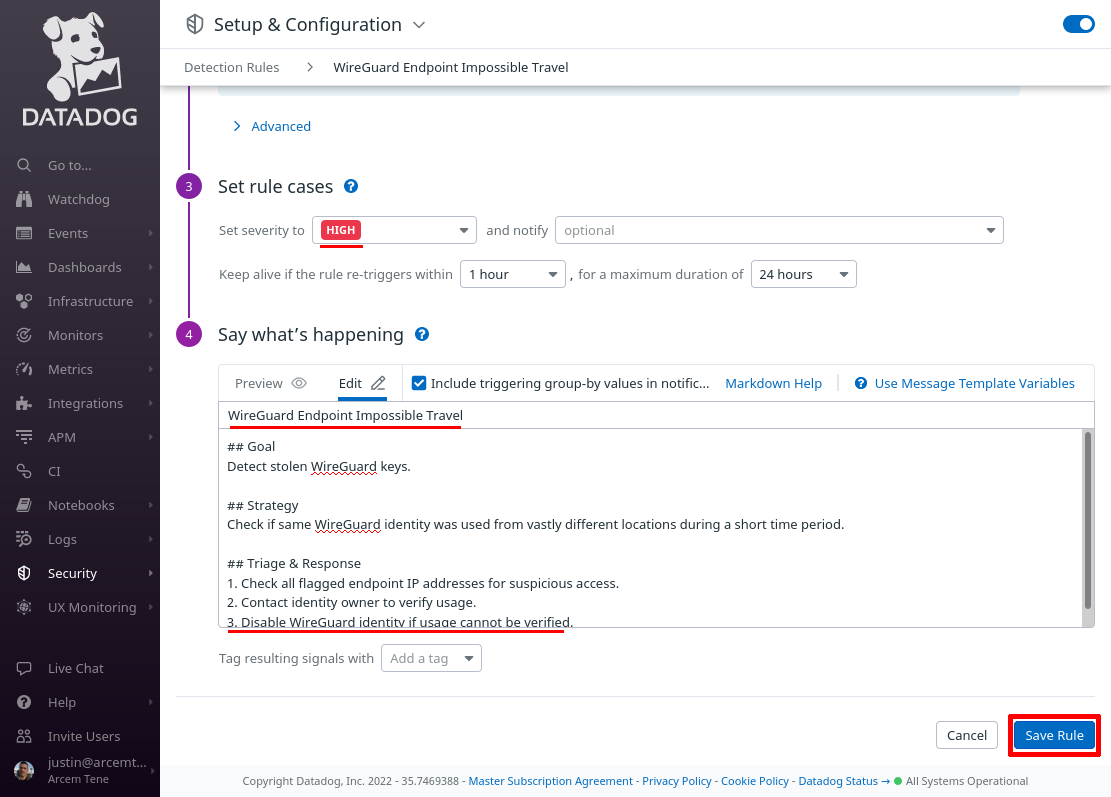
Scroll down to the “Set rule cases” section, and set them up appropriately; in this case, we’ve Set the severity to HIGH, and left the defaults for the other values.
In the “Say what’s happening” section, for the Rule name field, enter WireGuard Endpoint Impossible Travel. For the Rule message field, enter some text like the following:
## Goal
Detect stolen WireGuard keys.

## Strategy
Check if same WireGuard identity was used from vastly different locations during a short time period.

## Triage & Response
1. Check all flagged endpoint IP addresses for suspicious access.
2. Contact identity owner to verify usage.
3. Disable WireGuard identity if usage cannot be verified.
Finally, click the Save Rule button:
Log Authn
You can configure Pro Custodibus to send its own authentication logs to Datadog. Follow these steps to do so:
Set Up Pro Custodibus Webhooks for Log Authn
To set up the Pro Custodibus webhook that will push authentication logs to Datadog, log into the Pro Custodibus app, and navigate to the Admin area of the app; then click the Webhooks link:
Click the Add icon on the top-right corner of the Webhooks panel:
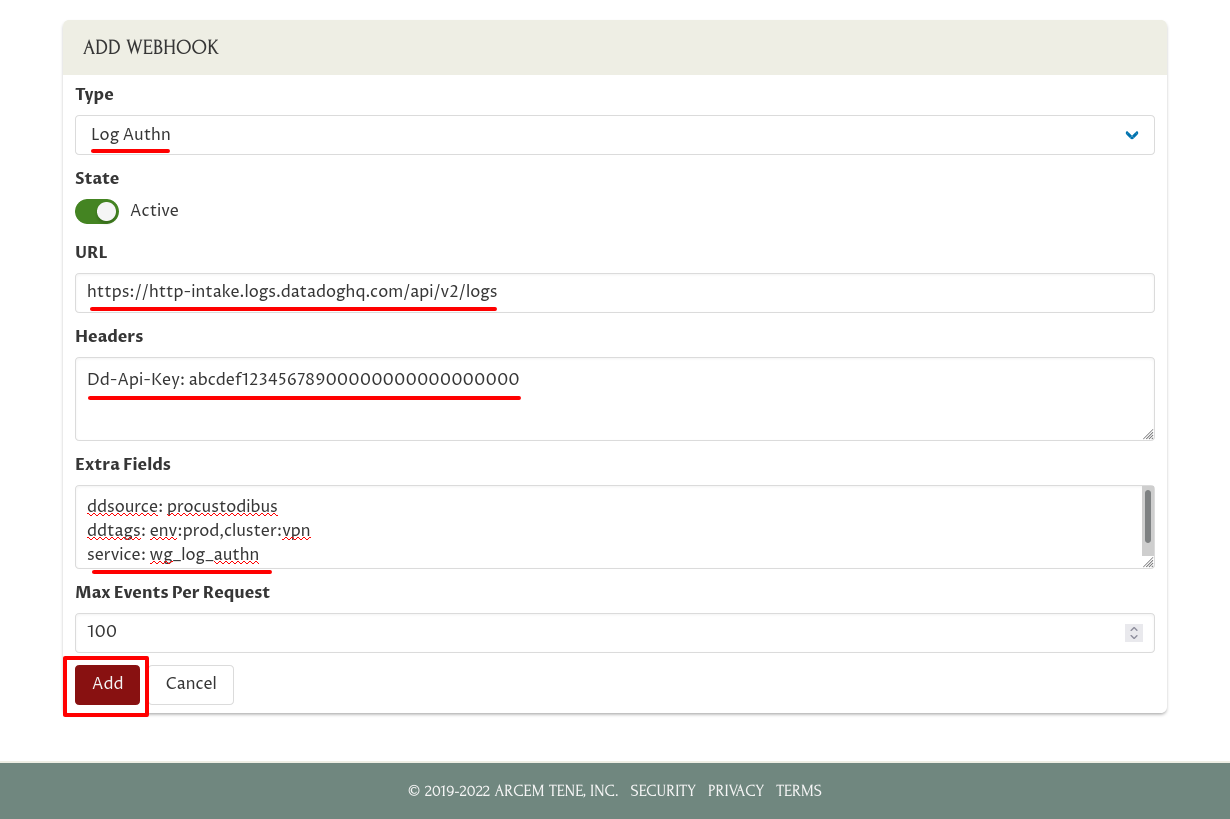
For the Type field, select Log Authn. For URL, enter https://http-intake.logs.datadoghq.com/api/v2/logs. For Headers, enter Dd-Api-Key: followed by your Datadog API Key. For Extra Fields, enter ddsource: procustodibus on one line, any tags you want on another line (in this example, ddtags: env:prod,cluster:vpn), and service: wg_log_authn on the last line. Then click the Add button:
|
Note
|
For Datadog sites other than |
Set Up Datadog Log Pipeline for Log Authn
Next, we’ll set up a Datadog log-management pipeline to map the authentication attributes that Pro Custodibus emits into attributes that better fit Datadog’s built-in functionality.
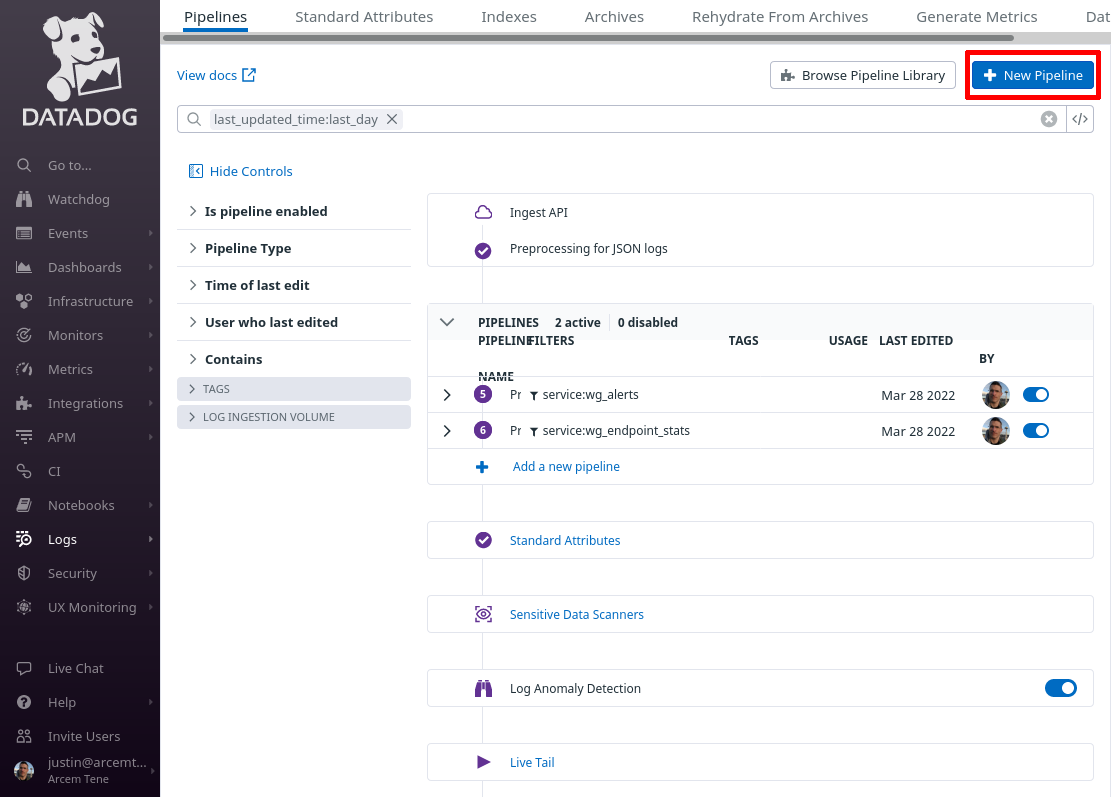
Log into the Datadog app, and navigate to the Configuration section of the Logs area of the app:
Click the New Pipeline button:
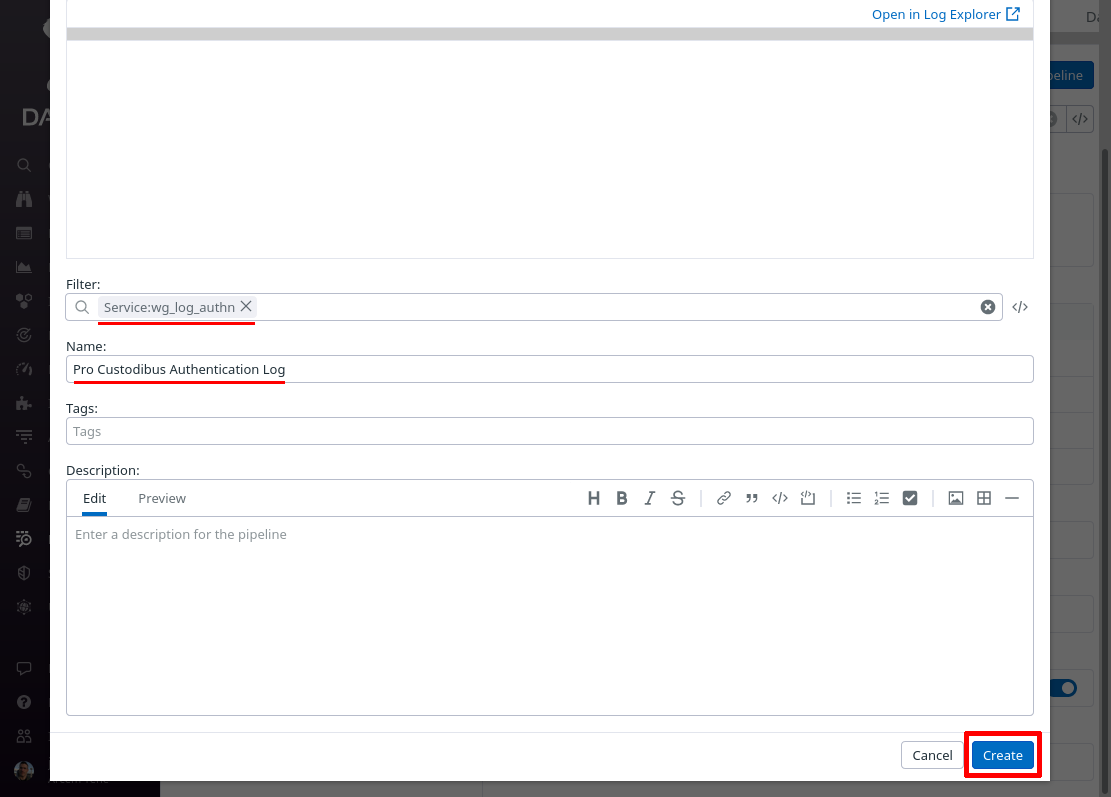
In the Filter field of the “Create Pipeline” dialog, enter service:wg_log_authn — since this filter matches the “service” setting from the Pro Custodibus webhook “Extra Fields” settings above, this pipeline will process only logs pushed from that webhook. In the Name field, enter a useful display name, like “Pro Custodibus Authentication Log”. Then click the Create button:
Toggle the expand button for the new pipeline, and then click the Add Processor link:
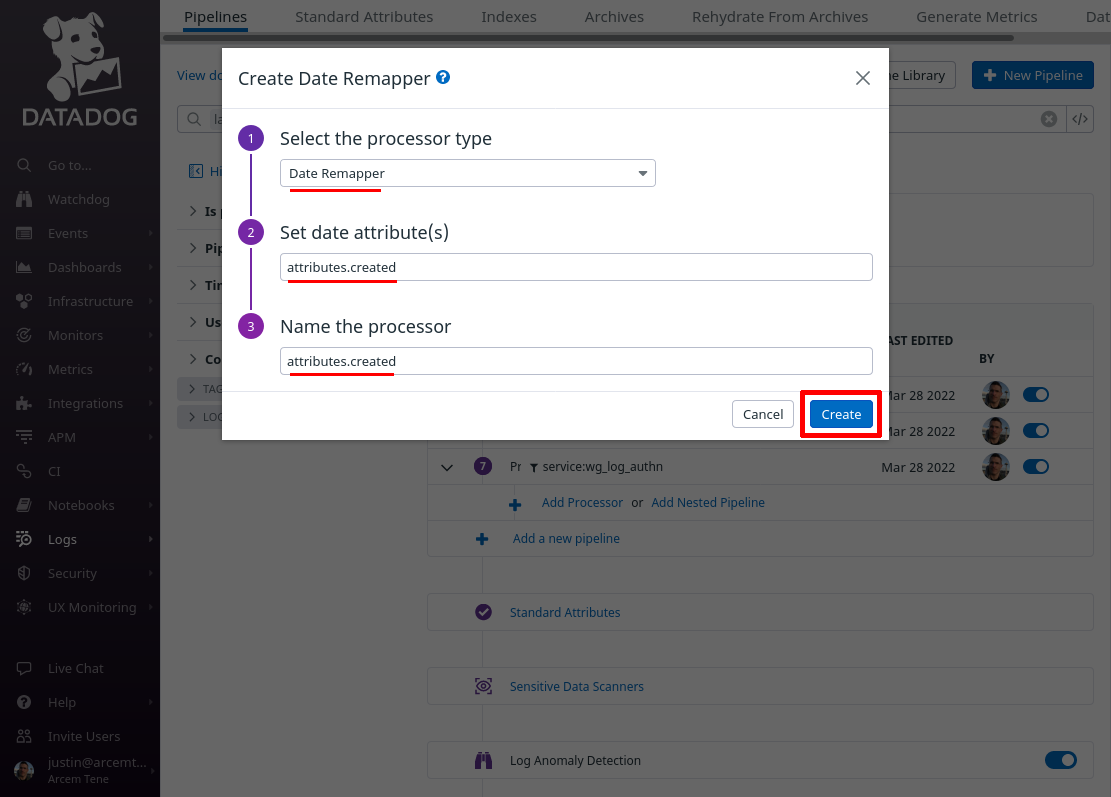
In the Select the processor type field, select Date Remapper. For the Set date attribute(s) field, enter attributes.created — this is the field Pro Custodibus uses to indicate the log entry’s date. For the Name the processor field, enter a useful display name, like “attributes.created”. Then click the Create button:
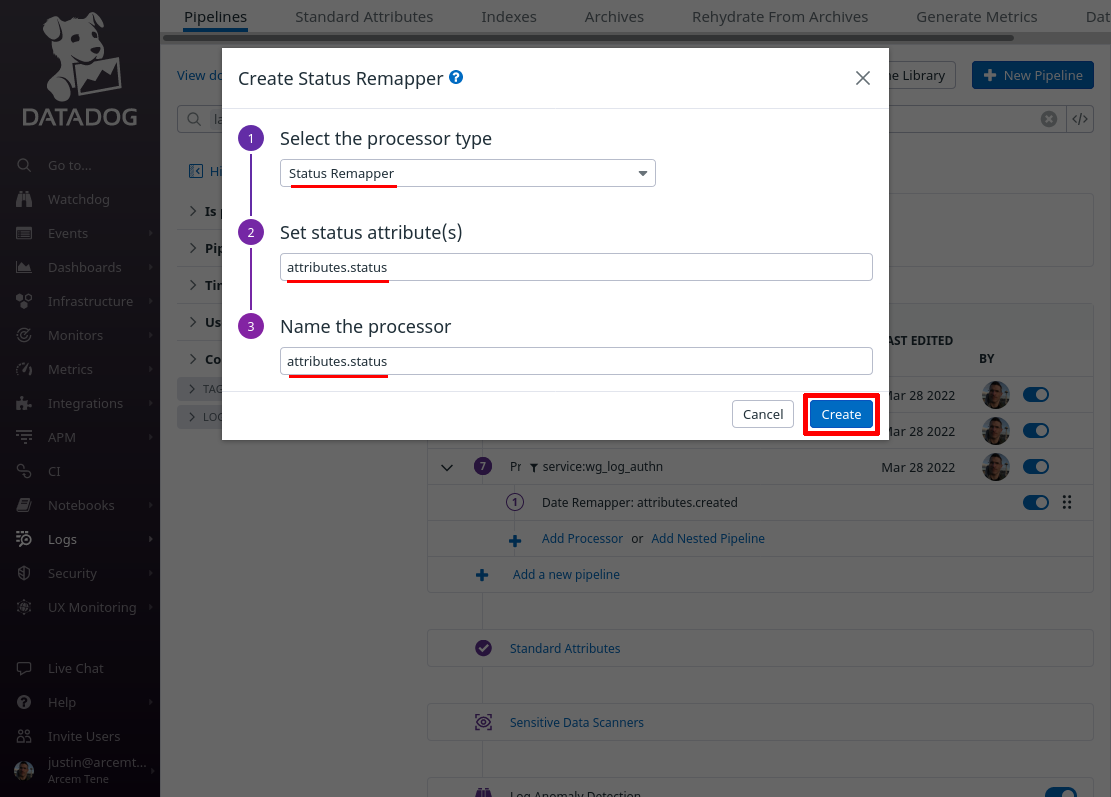
Now click the Add Processor link again; this time for the Select processor type field, select Status Remapper. For the Set status attribute(s) field, enter attributes.status. For the Name the processor field, enter a useful display name like “attributes.status”, and click the Create button:
Click the Add Processor link again; this time we’ll create a mapping from the field that identifies the specific user attempting authentication to a custom Datadog attribute field. We have to do this in a round-about way, with a “String Builder Processor” instead of a simple “Remapper”, because the Pro Custodibus ID for the user is sent inside of an array.
So for the Select processor type field, select String Builder Processor. For the Set target attribute path field, enter wg.user.id (this is the name of the new Datadog attribute we’ll create). For the Set the target attribute value field, enter %{relationships.user.data.id} (an expression that resolves to the Pro Custodibus ID for the user). For the Name the processor field, enter a useful display name, like “wg.user.id”. Then click the Create button:

Click the Add Processor link again; now we’ll add a lookup mapping from the Datadog wg.user.id attribute we just created to be able to show a display name for the user.
For the Select processor type field, select Lookup Processor. For the Set lookup mapping field, enter a CSV list of values like the following (for an example environment), which maps a Pro Custodibus user ID in the first column to a display name for the user in the second column:

|
Tip
|
You can compile a list of mappings for your own environment by navigating to each user in Pro Custodibus, and copying their ID. With our example environment, this Pro Custodibus page shows that 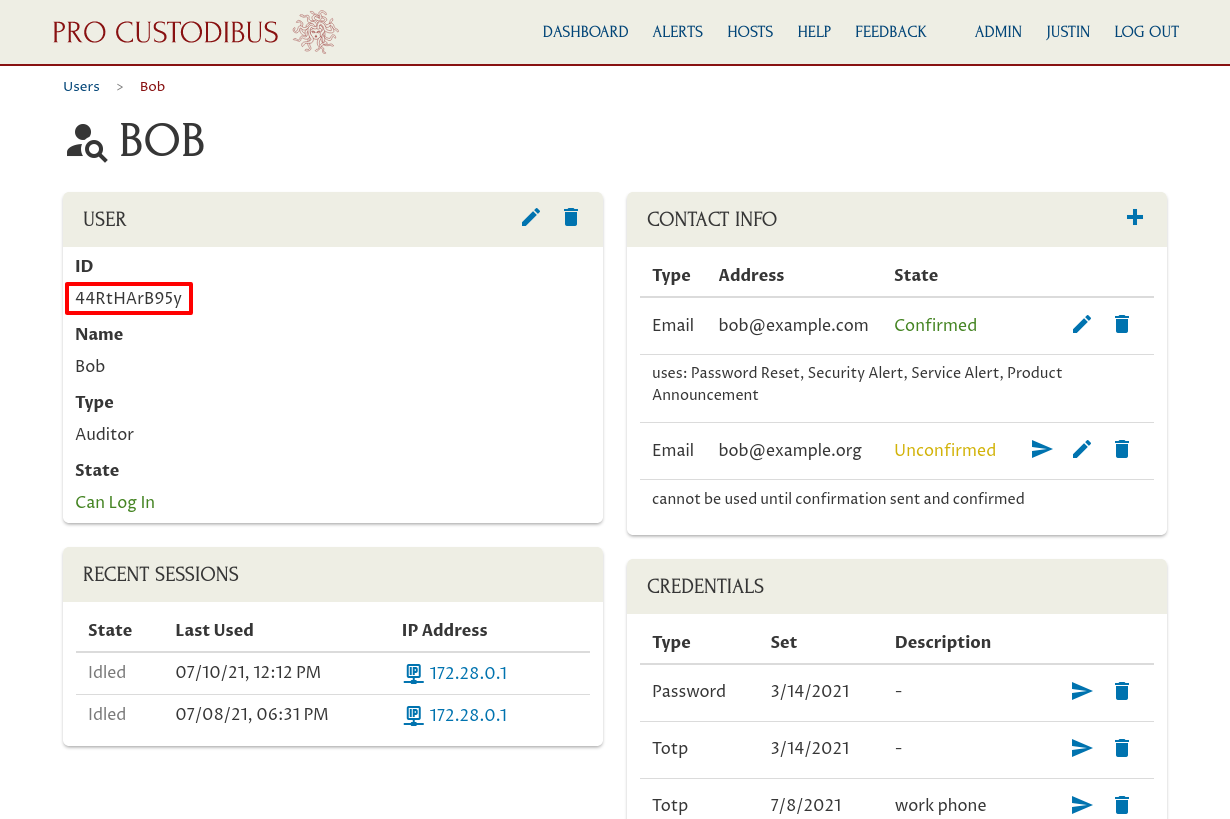
|
In the “Create Lookup Processor” dialog, scroll down, and for the Set source attribute field, enter wg.user.id (the first column in the CSV list will match this attribute value). For the Set target attribute path field, enter wg.user.name (this is the name of the new Datadog attribute we’ll create, using the values from the second column). For the Name the processor field, enter a useful display name like “wg.user.name”. Then click the Create button:

Click the Add Processor link again; this time we’ll map the attribute Pro Custodibus uses for the source IP address of the authentication attempt to a new custom Datadog attribute, for our own convenience.
For the Select processor type field, select Remapper. For the Set attribute(s) or tag key to remap field, enter attributes.ip (this is the name of the attribute Pro Custodibus uses for source IP address).
For the Set target attribute or tag key field, enter wg.user.ip (this is the name of the new Datadog attribute we’ll create; if you already have a standard attribute you use for event source IP addresses, such as network.client.ip, you may want to use that attribute here instead). For the Name the processor field, enter a useful display name like “wg.user.ip”. Then click the Create button:

Click the Add Processor link again; now we’ll map the attribute Pro Custodibus uses to list authentication components that failed to a new custom Datadog attribute, again for our own convenience.
For the Select processor type field, select Remapper. For the Set attribute(s) or tag key to remap field, enter attributes.errors (this is the name of the attribute Pro Custodibus uses for the list of authentication components that failed).
For the Set target attribute or tag key field, enter wg.user.errors (this is the name of the new Datadog attribute we’ll create; if you already have a standard attribute you use for event errors, you may want to use that attribute here instead). For the Name the processor field, enter a useful display name like “wg.user.errors”. Then click the Create button:

Click the Add Processor link one more time; lastly, we’ll map the attribute Pro Custodibus uses to list authentication components that succeeded to a new custom Datadog attribute, again for our own convenience.
For the Select processor type field, select Remapper. For the Set attribute(s) or tag key to remap field, enter attributes.verifications (this is the name of the attribute Pro Custodibus uses for the list of authentication components that succeeded).
For the Set target attribute or tag key field, enter wg.user.verifications (this is the name of the new Datadog attribute we’ll create; if you already have a standard attribute you use for event successes, you may want to use that attribute here instead). For the Name the processor field, enter a useful display name like “wg.user.verifications”. Then click the Create button:

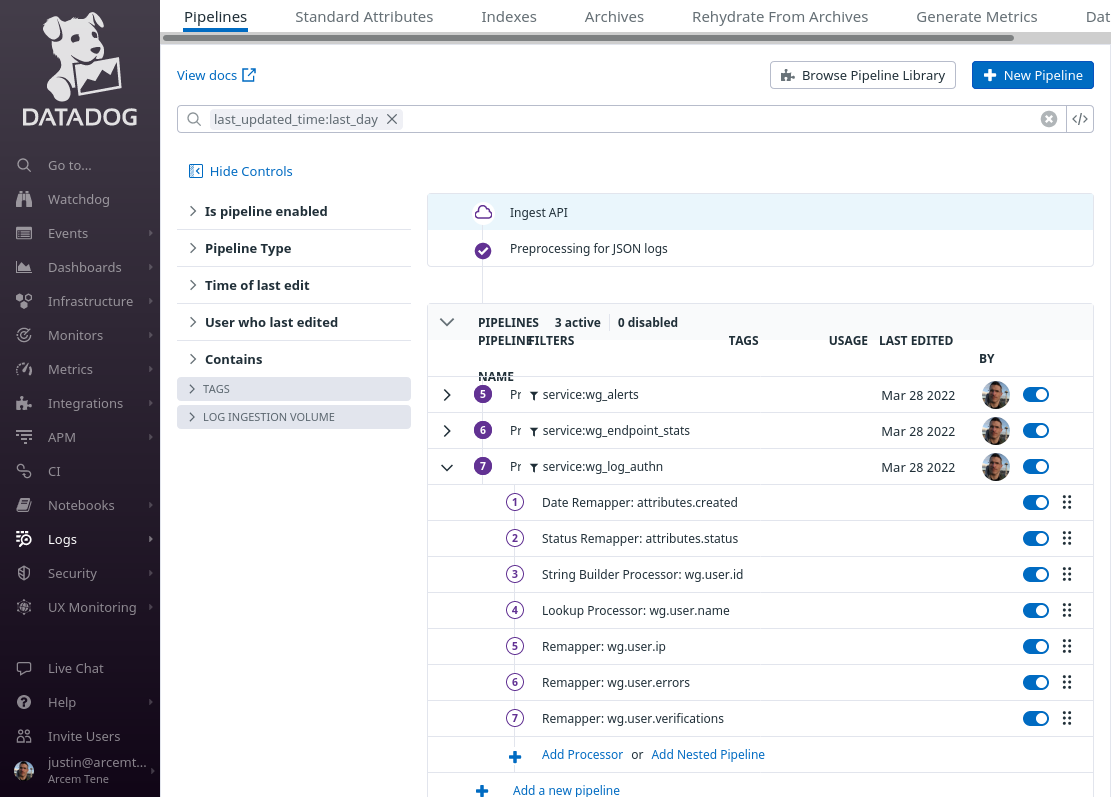
At the end of this process, your authentication log pipeline should look like the following:
Set Up Datadog Log Explorer for Log Authn
Next, we’ll set up the Datadog log explorer with some useful log facets and a custom view to show our new authentication logs.
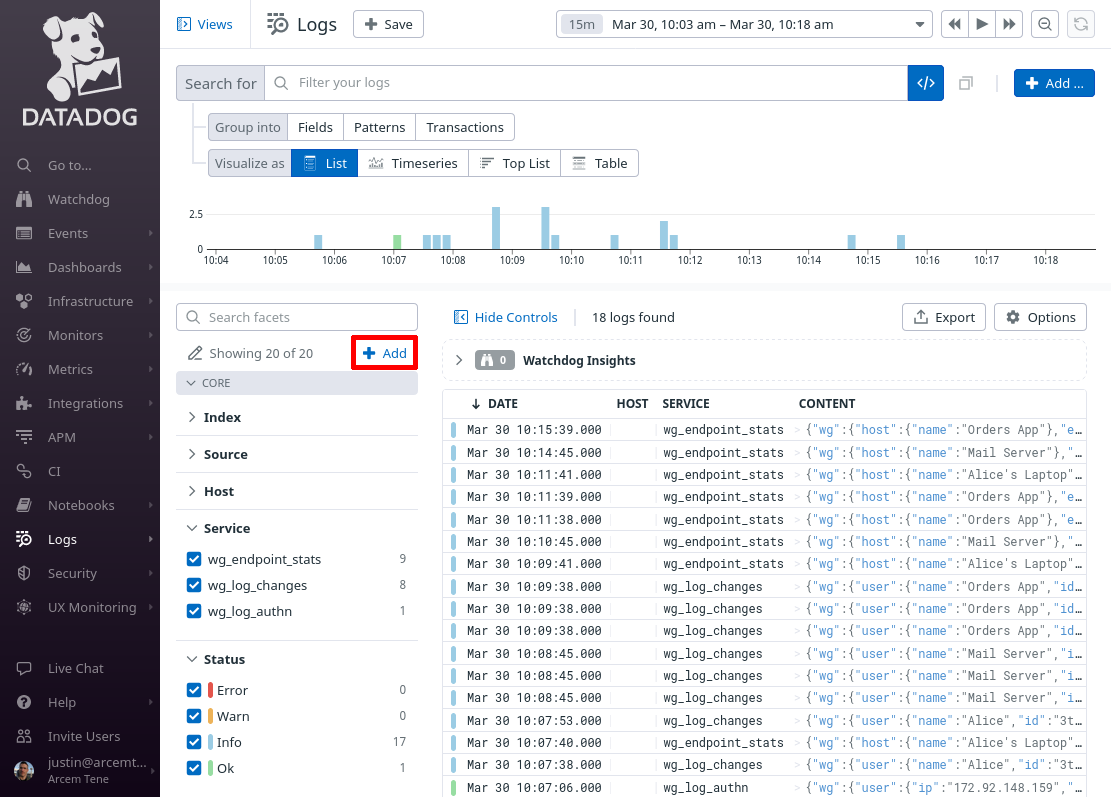
In the Datadog app, navigate to the Search section of the Logs area of the app:
In the facets pane on the right side of the log search page, click the Add button:
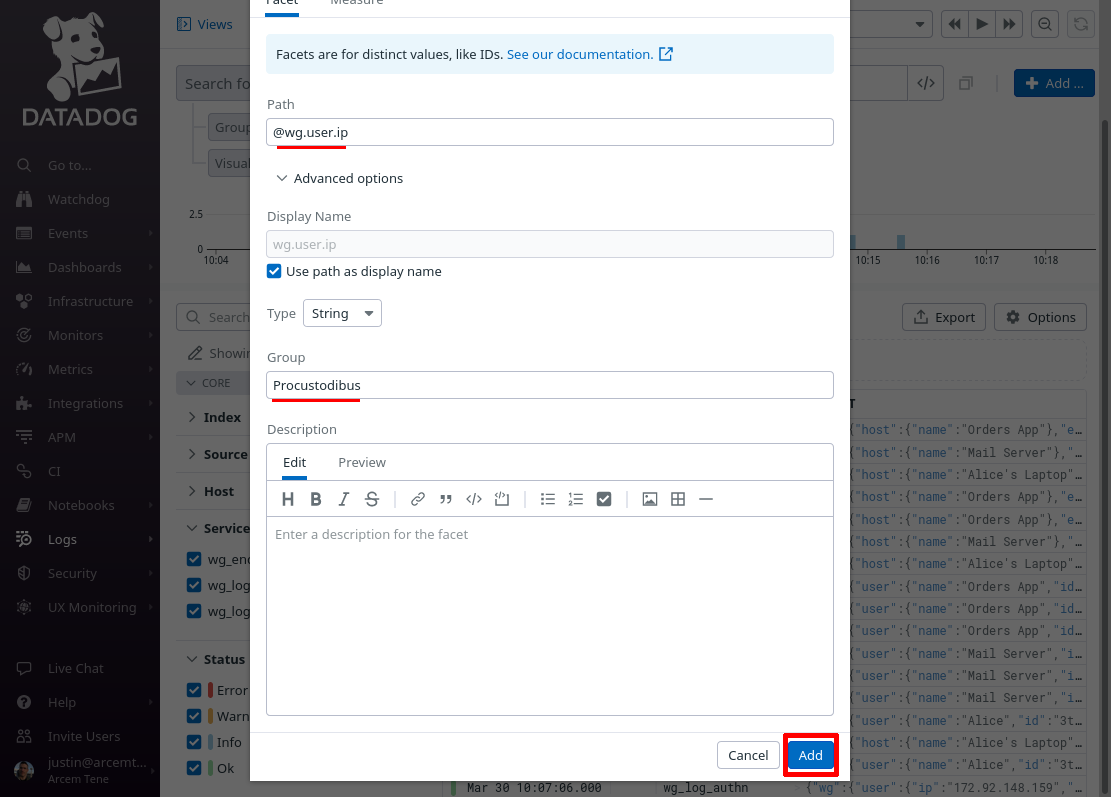
On the “Add facet” dialog, in the Path field, enter @wg.user.ip (or whatever Datadog attribute you remapped from the source Pro Custodibus attributes.ip attribute in the previous section). For the Group field, enter Procustodibus (or the name of some custom group that you’d rather use). Then click the Add button:
Do the same for these other attributes that we set up in the previous section:
-
wg.user.name -
wg.user.errors -
wg.user.verifications
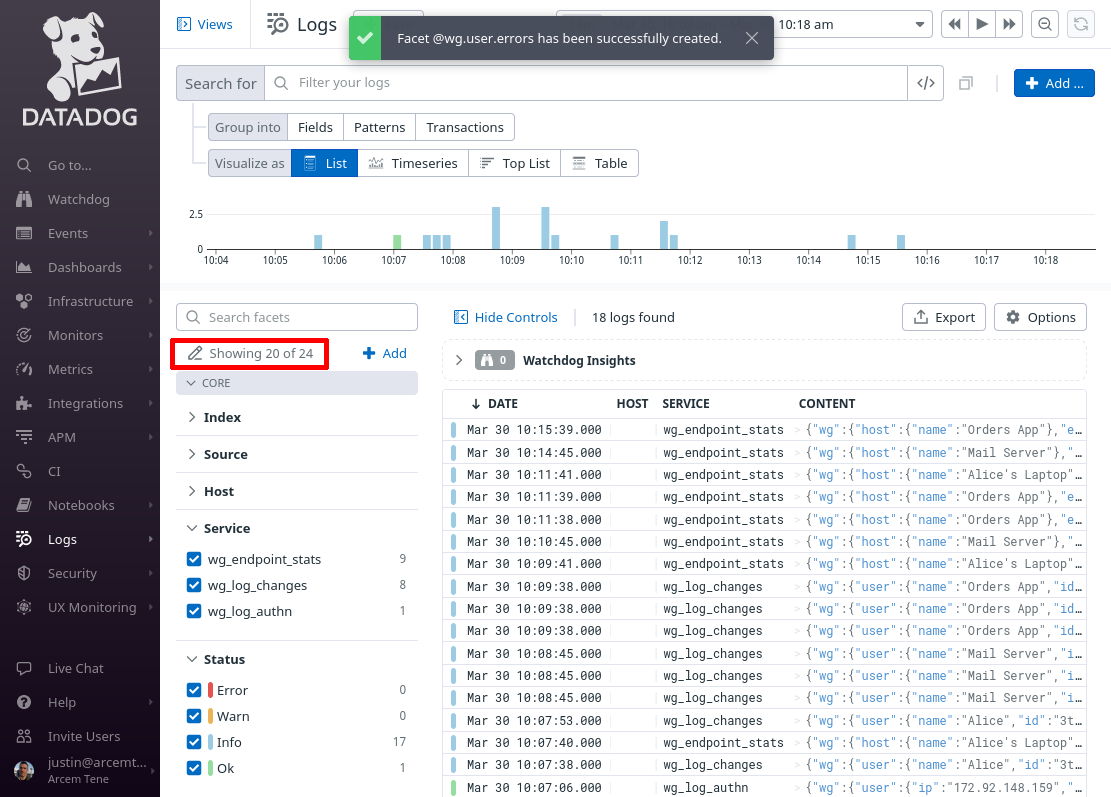
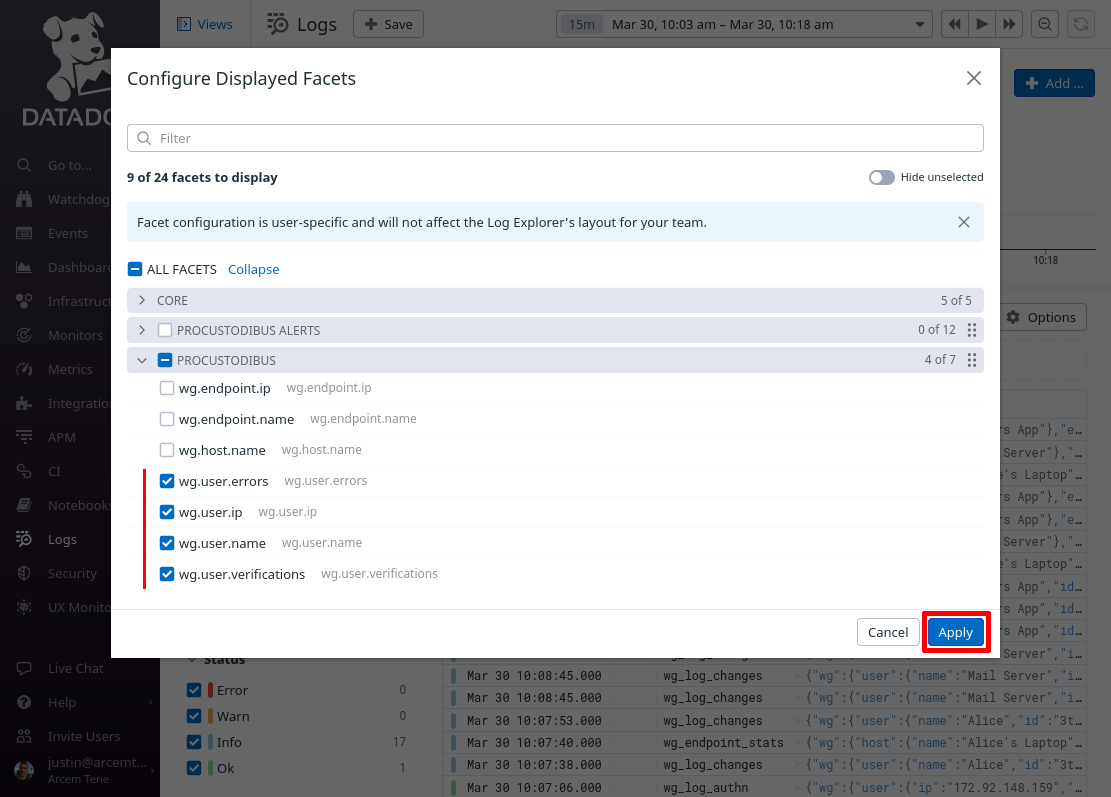
When done, click the Showing X of Y link in the facets pane:
Select all the facets you just added, so that you can see them in the facets pane of the main log explorer page, and click the Apply button:
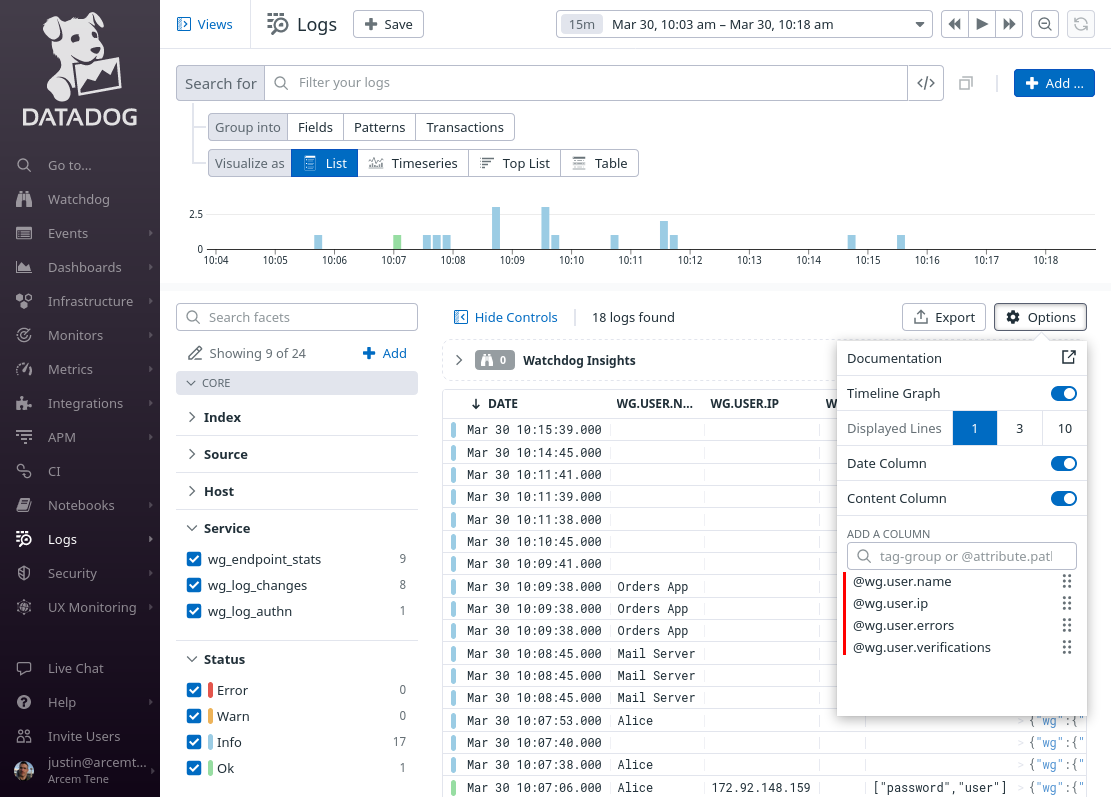
Then click the Options button above the list of log entries to customize the columns displayed in the list:

Remove the existing columns (other than Date and Content), and add the following columns:
-
wg.user.name -
wg.user.ip -
wg.user.errors -
wg.user.verifications
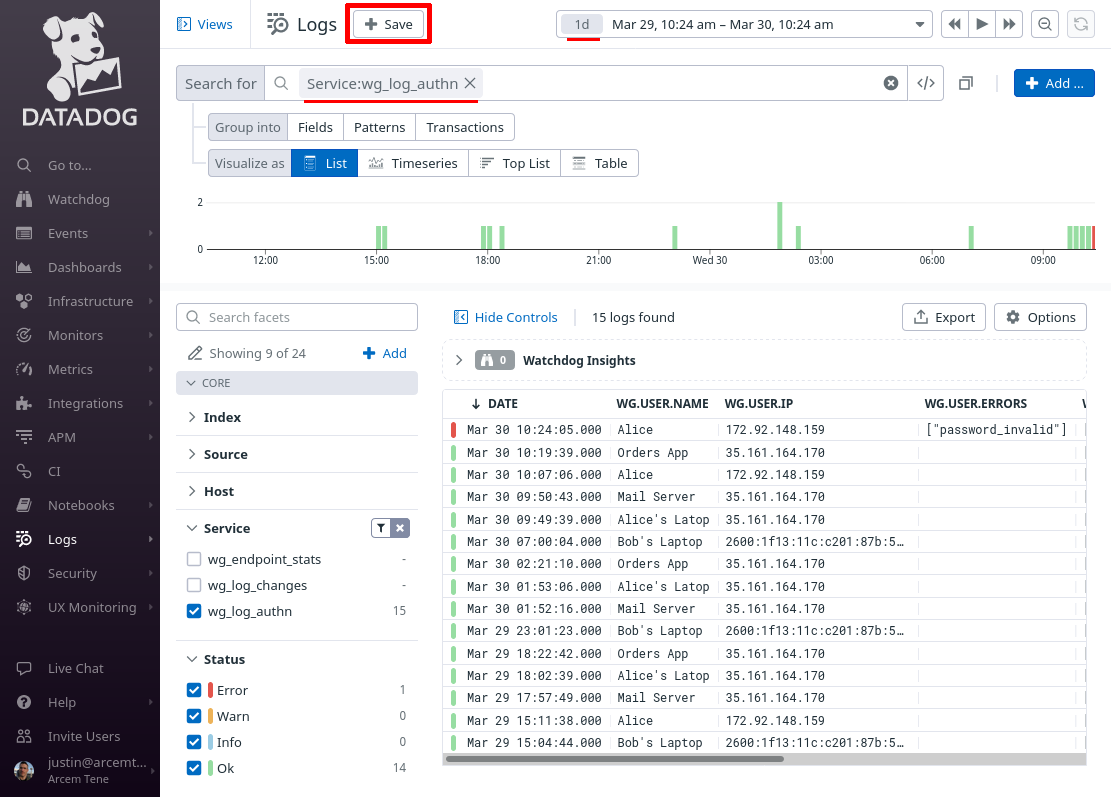
Change the Search for field to service:wg_log_authn, and the time range to the past day (or past week). Then click the Save button:
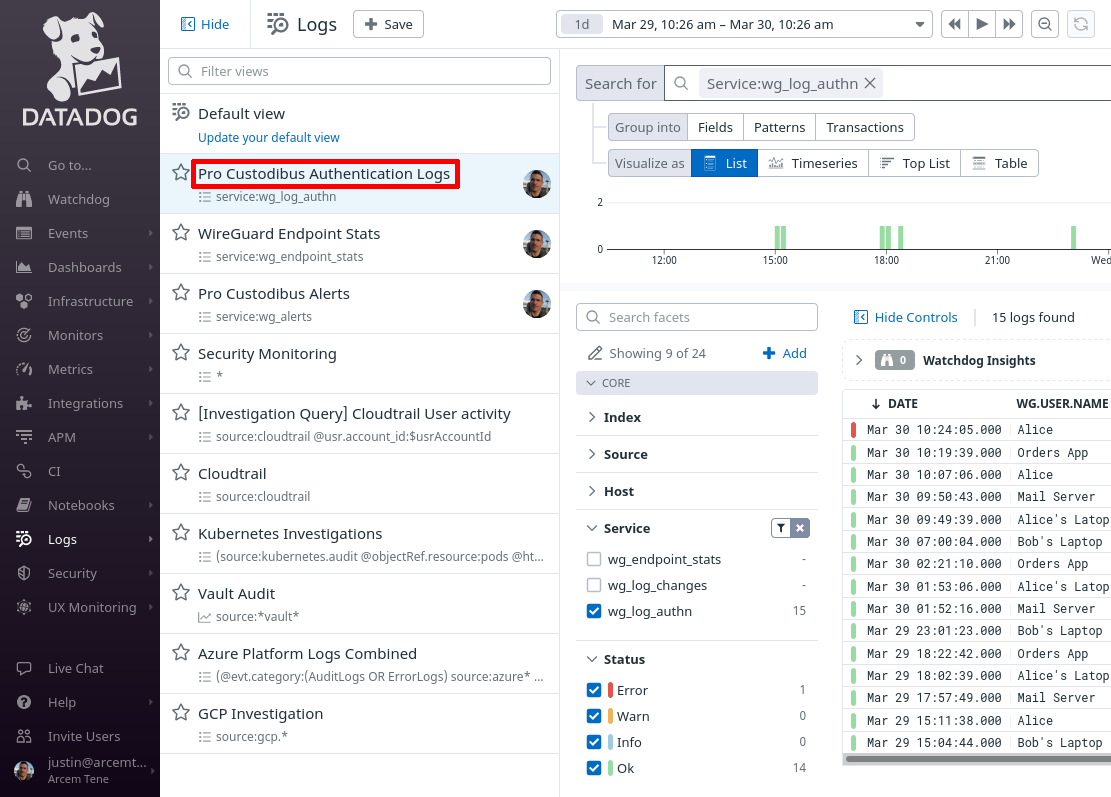
In the New view field, enter Pro Custodibus Authentication Logs, and click the Save button:
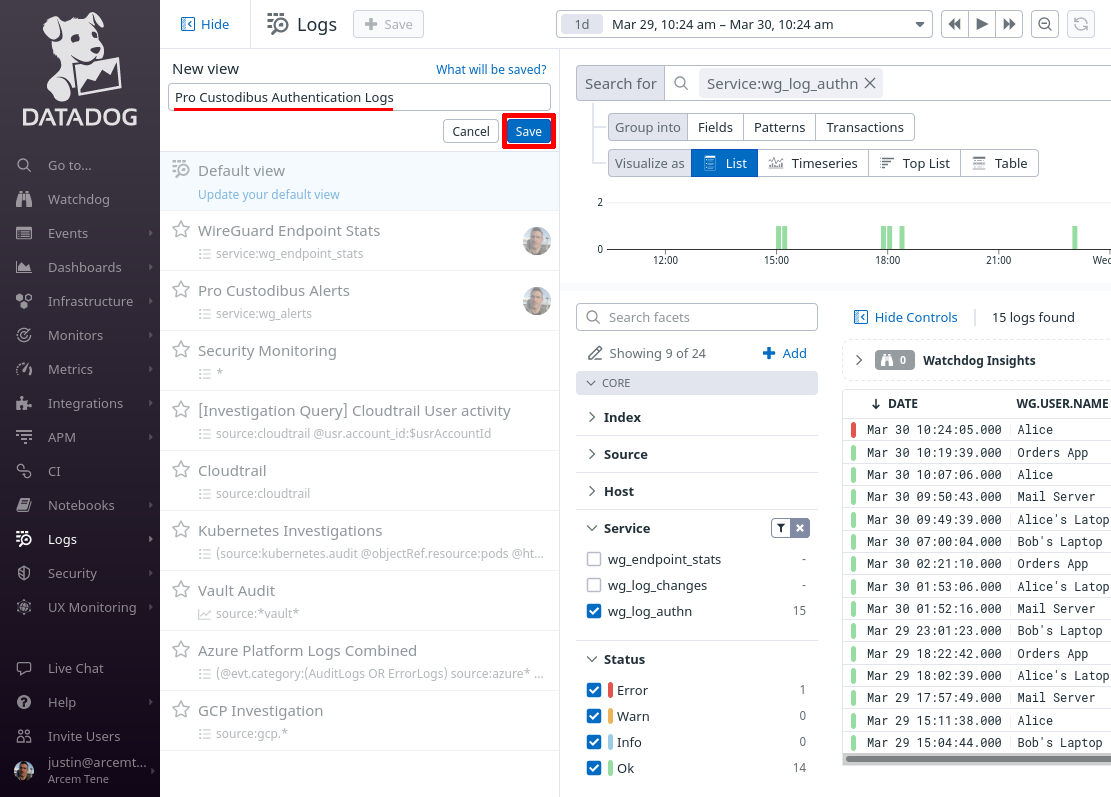
You can return to this view later to when you want to check on Pro Custodibus authentication attempts (both by automated agents, as well as human users):
Set Up Datadog Security Detection Rules for Log Authn
Finally, we’ll set up Datadog’s Cloud SIEM with our first custom detection rule for our Pro Custodibus authentication logs. We’ll set up a rule that will detect if a user has attempted to log into Pro Custodibus from an IP address that’s different than anyone else has previously used in the last couple of weeks.
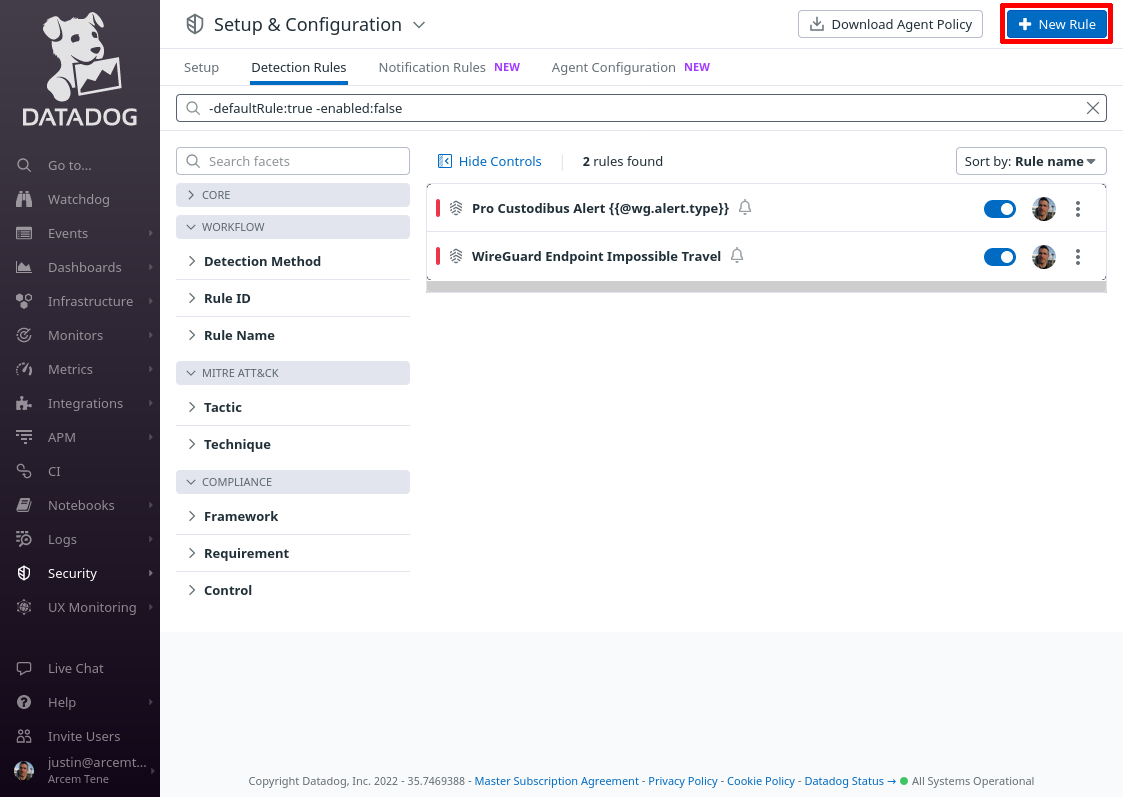
In the Datadog app, navigate to the Detection Rules section of the Security area of the app:
Click the New Rule button:
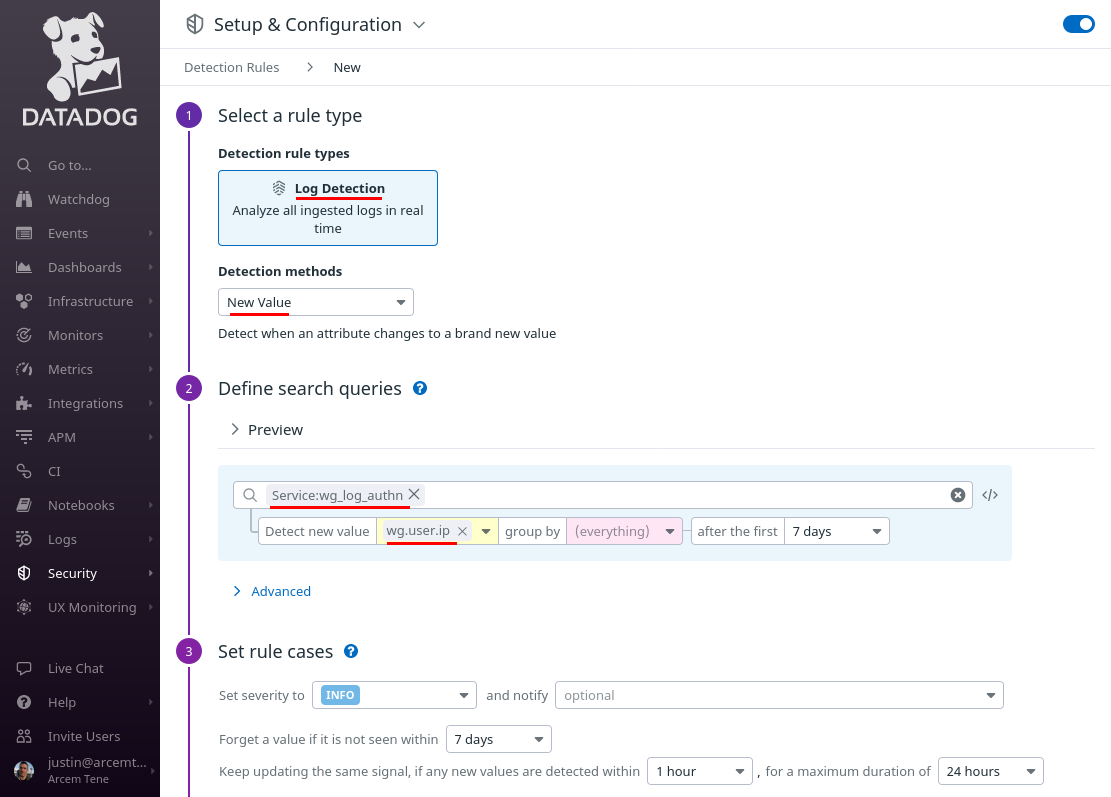
For Detection rule types, select Log Detection, and for Detection methods, select New Value.
Then for Define search queries, enter service:wg_log_authn, and for Detect new value, enter wg.user.ip:
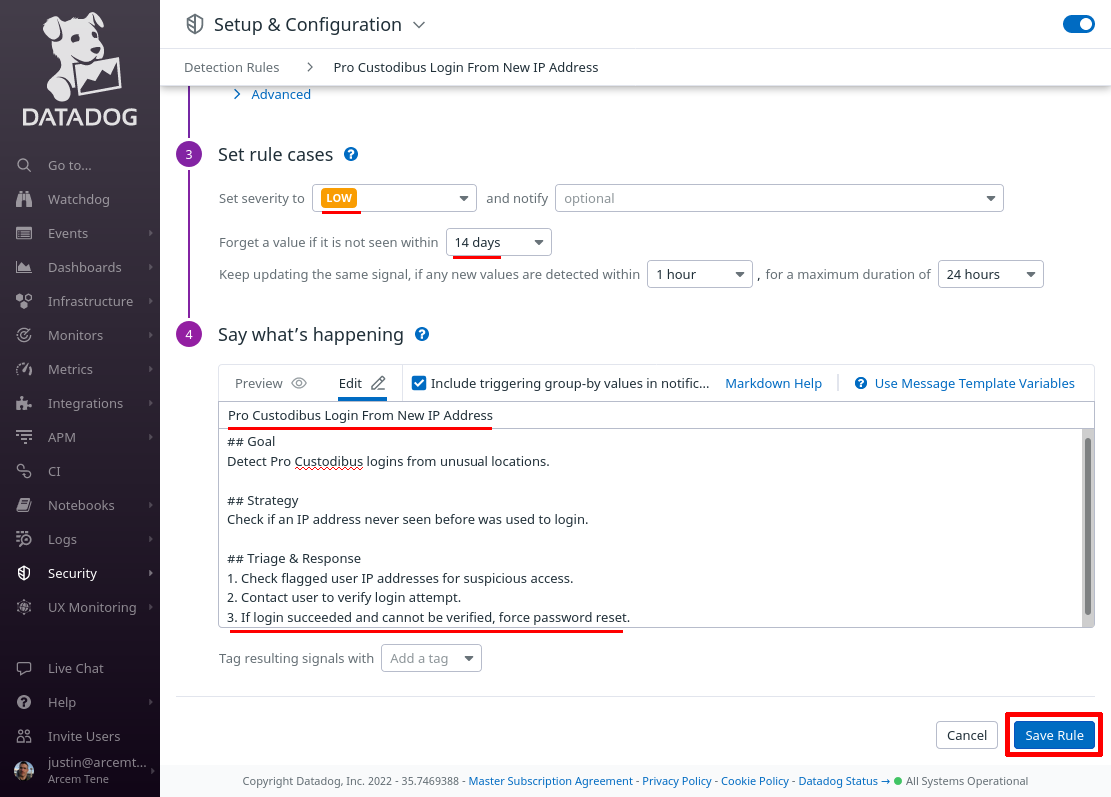
Scroll down to the “Set rule cases” section, and set them up appropriately; in this case, we’ve Set the severity to LOW, the Forget a value if it is not seen within field to 14 days, and left the defaults for the other values.
In the “Say what’s happening” section, for the Rule name field, enter Pro Custodibus Login From New IP Address. For the Rule message field, enter some text like the following:
## Goal
Detect Pro Custodibus logins from unusual locations.

## Strategy
Check if an IP address never seen before was used to login.

## Triage & Response
1. Check flagged user IP addresses for suspicious access.
2. Contact user to verify login attempt.
3. If login succeeded and cannot be verified, force password reset.
Finally, click the Save Rule button:
Log Changes
You can configure Pro Custodibus to send its log of resource changes to Datadog. These changes include WireGuard-related changes, such as when a WireGuard interface is started up, or the IP address of a WireGuard endpoint changes; as well as non-WireGuard changes, such as when a Pro Custodibus user is created or deleted, or when the settings are changed for a Pro Custodibus organization.
Follow these steps to connect Pro Custodibus’ change events to Datadog:
Set Up Pro Custodibus Webhooks for Log Changes
To set up the Pro Custodibus webhook that will push change logs to Datadog, log into the Pro Custodibus app, and navigate to the Admin area of the app; then click the Webhooks link:
Click the Add icon on the top-right corner of the Webhooks panel:
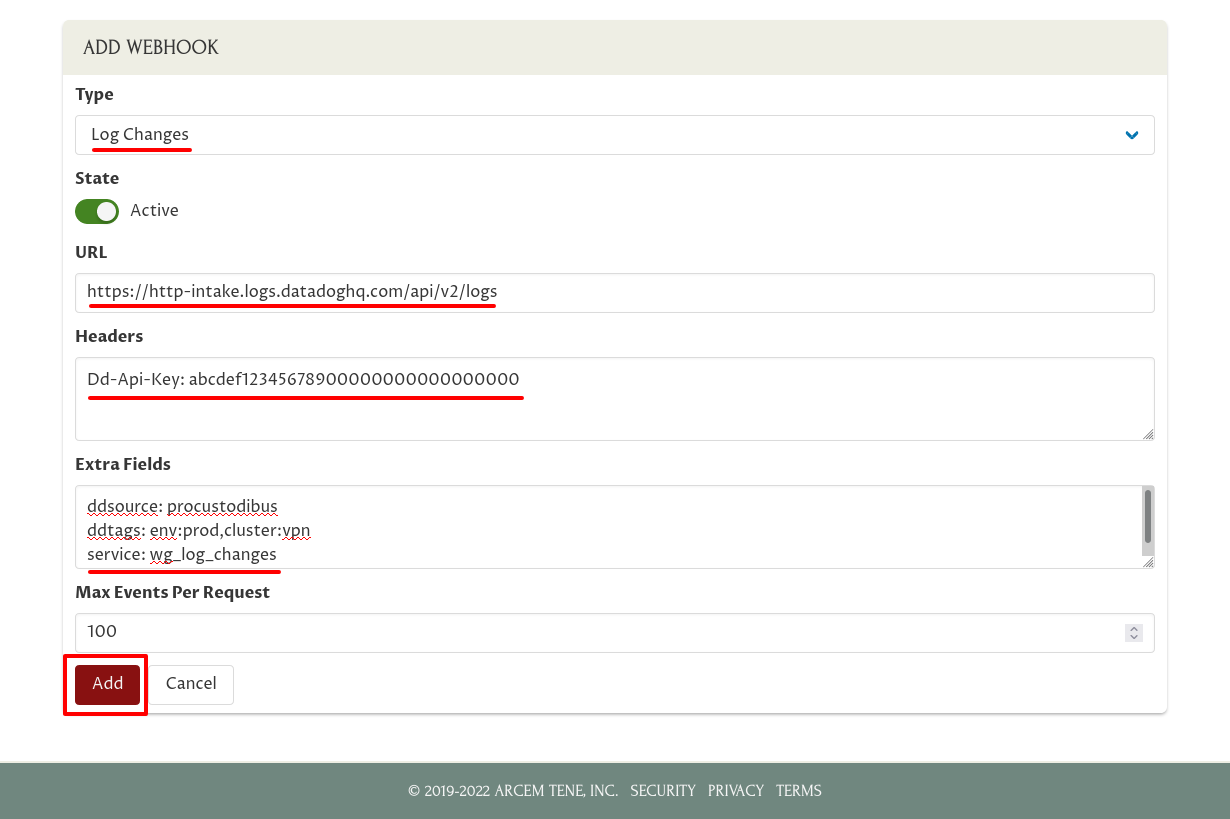
For the Type field, select Log Changes. For URL, enter https://http-intake.logs.datadoghq.com/api/v2/logs. For Headers, enter Dd-Api-Key: followed by your Datadog API Key. For Extra Fields, enter ddsource: procustodibus on one line, any tags you want on another line (in this example, ddtags: env:prod,cluster:vpn), and service: wg_log_changes on the last line. Then click the Add button:
|
Note
|
For Datadog sites other than |
Set Up Datadog Log Pipeline for Log Changes
Next, we’ll set up a Datadog log-management pipeline to map the attributes that Pro Custodibus emits for resource changes into attributes that better fit Datadog’s built-in functionality.
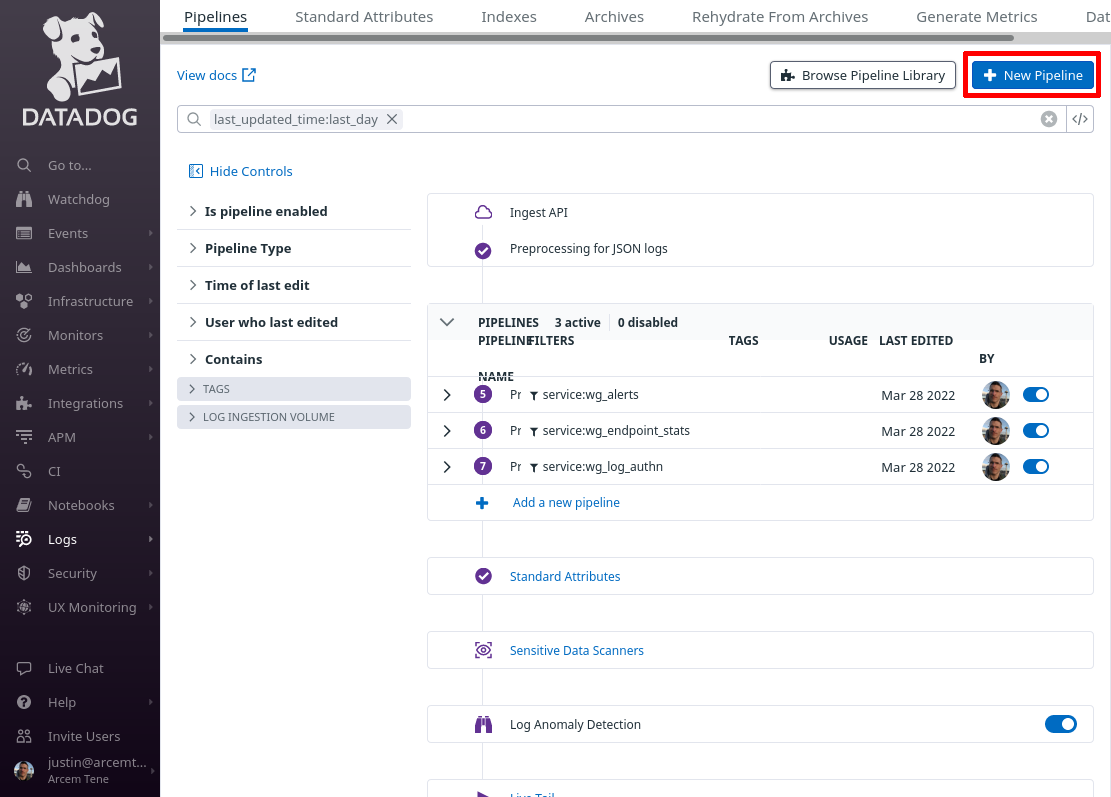
Log into the Datadog app, and navigate to the Configuration section of the Logs area of the app:
Click the New Pipeline button:
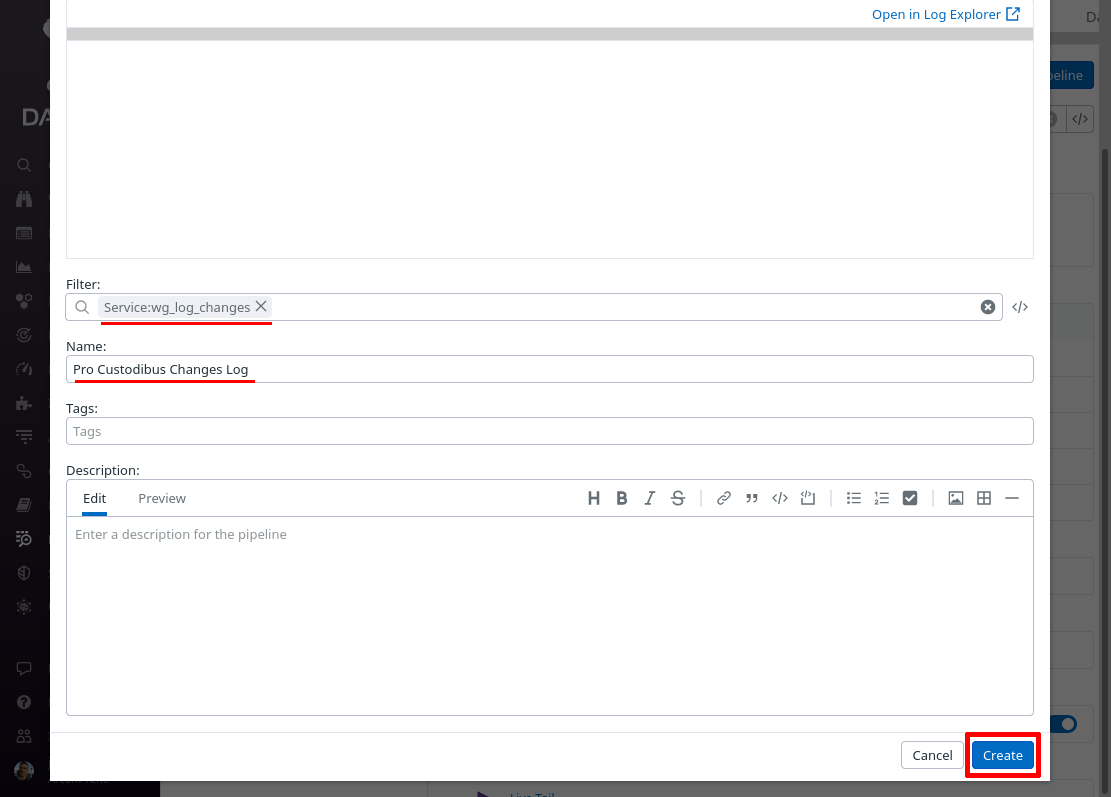
In the Filter field of the “Create Pipeline” dialog, enter service:wg_log_changes — since this filter matches the “service” setting from the Pro Custodibus webhook “Extra Fields” settings above, this pipeline will process only logs pushed from that webhook. In the Name field, enter a useful display name, like “Pro Custodibus Changes Log”. Then click the Create button:
Toggle the expand button for the new pipeline, and then click the Add Processor link:
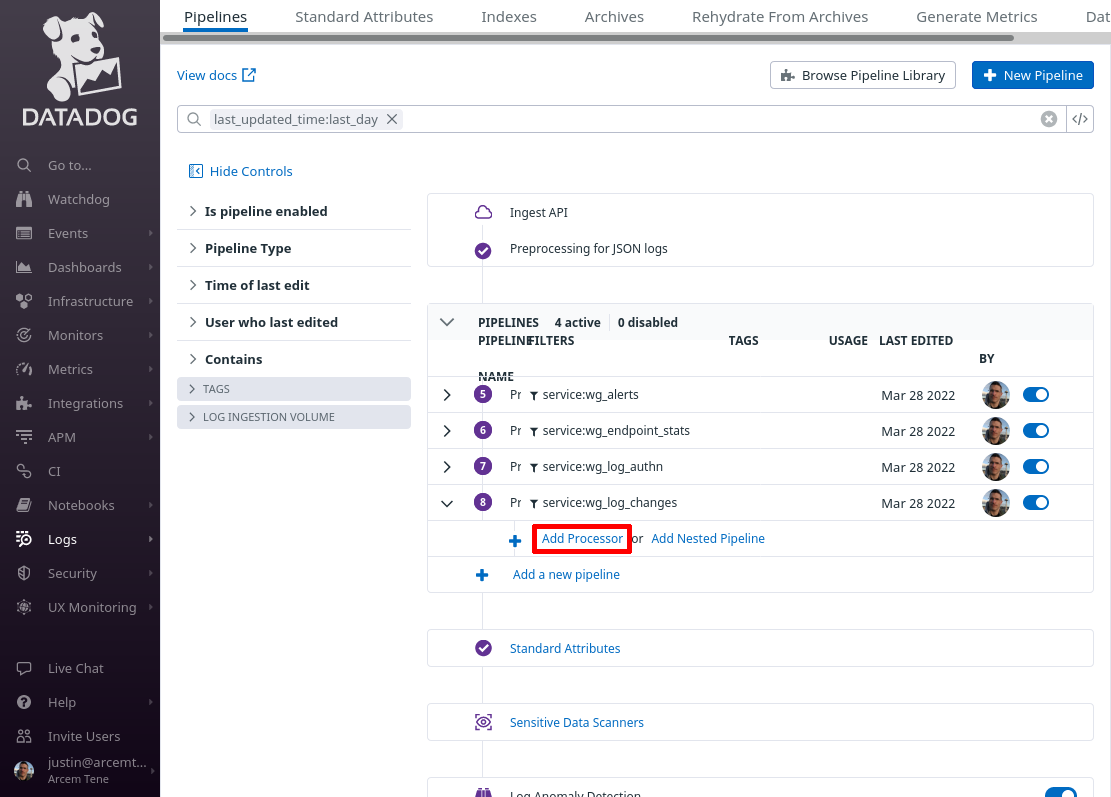
In the Select the processor type field, select Date Remapper. For the Set date attribute(s) field, enter attributes.created — this is the field Pro Custodibus uses to indicate the log entry’s date. For the Name the processor field, enter a useful display name, like “attributes.created”. Then click the Create button:

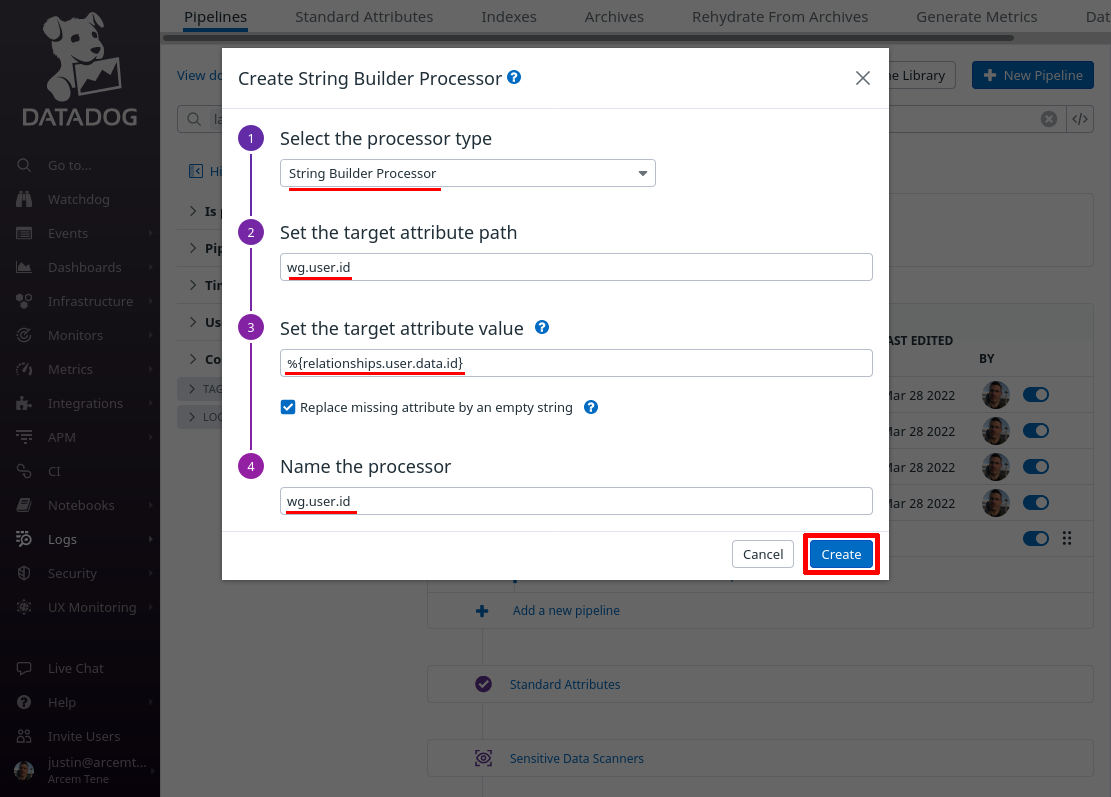
Now click the Add Processor link again; this time we’ll create a mapping from the field that identifies the specific user who made the change, mapping it to a custom Datadog attribute field. We have to do this in a round-about way, with a “String Builder Processor” instead of a simple “Remapper”, because the Pro Custodibus ID for the user is sent inside of an array.
So for the Select processor type field, select String Builder Processor. For the Set target attribute path field, enter wg.user.id (this is the name of the new Datadog attribute we’ll create). For the Set the target attribute value field, enter %{relationships.user.data.id} (an expression that resolves to the Pro Custodibus ID for the user). For the Name the processor field, enter a useful display name, like “wg.user.id”. Then click the Create button:
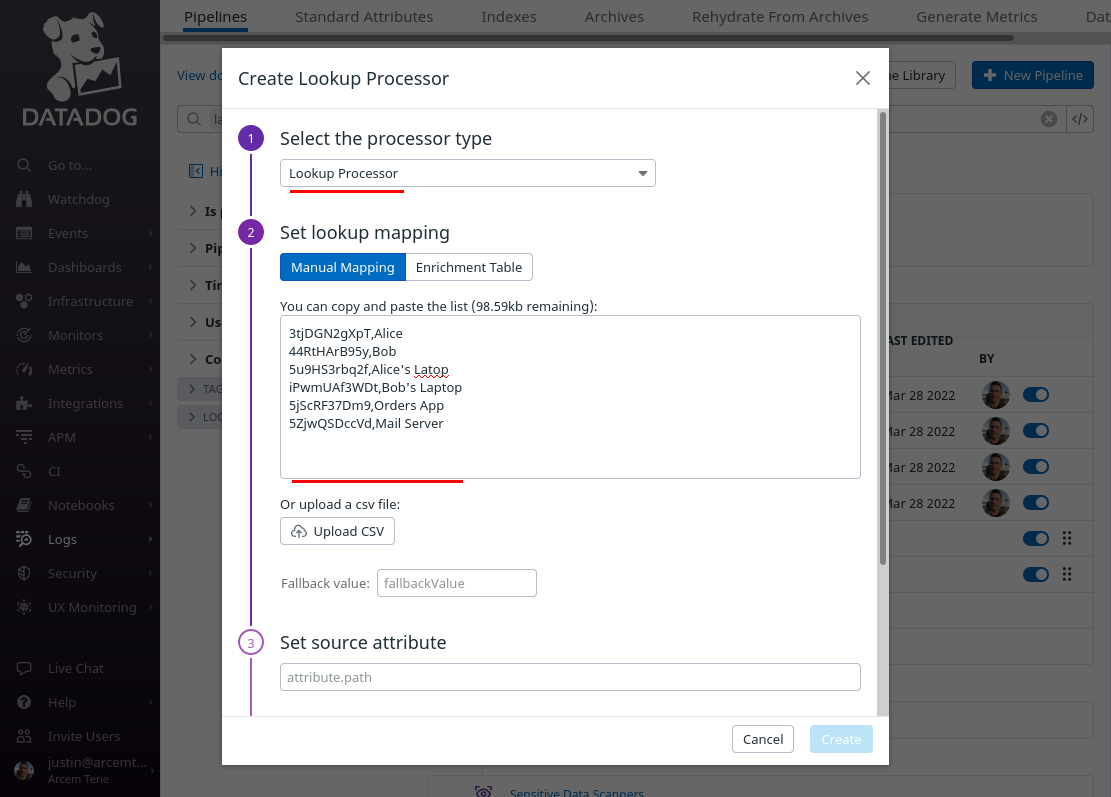
Click the Add Processor link again; now we’ll add a lookup mapping from the Datadog wg.user.id attribute we just created to be able to show a display name for the user.
For the Select processor type field, select Lookup Processor. For the Set lookup mapping field, enter a CSV list of values like the following (for an example environment), which maps a Pro Custodibus user ID in the first column to a display name for the user in the second column:
|
Tip
|
You can compile a list of mappings for your own environment by navigating to each user in Pro Custodibus, and copying their ID. With our example environment, this Pro Custodibus page shows that
|
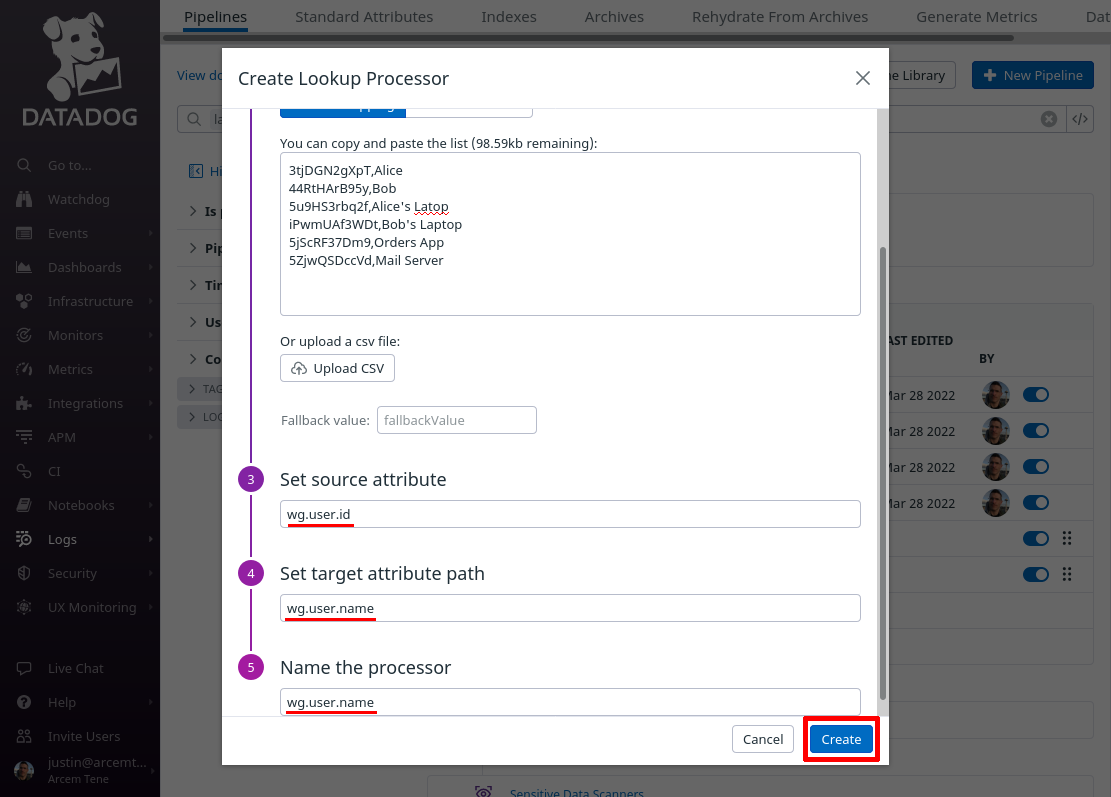
In the “Create Lookup Processor” dialog, scroll down, and for the Set source attribute field, enter wg.user.id (the first column in the CSV list will match this attribute value). For the Set target attribute path field, enter wg.user.name (this is the name of the new Datadog attribute we’ll create, using the values from the second column). For the Name the processor field, enter a useful display name like “wg.user.name”. Then click the Create button:
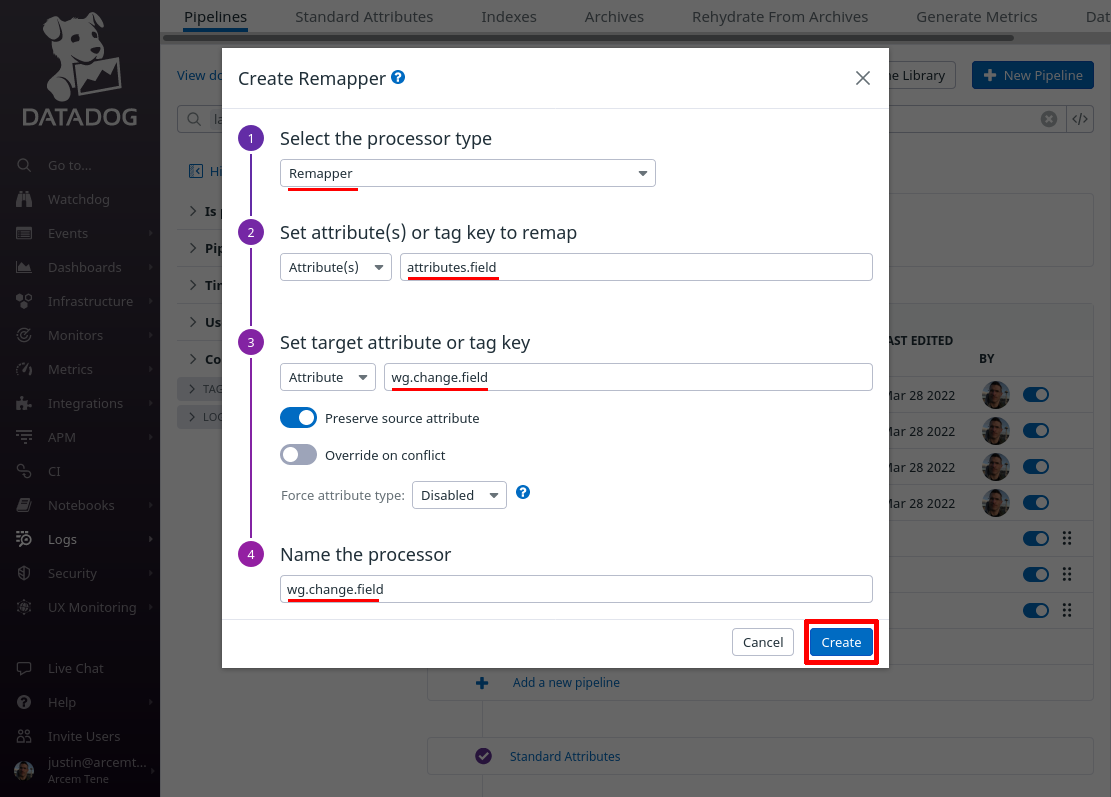
Click the Add Processor link again; this time we’ll map the attribute Pro Custodibus uses for the name of the field that changed to a new custom Datadog attribute, for our own convenience.
For the Select processor type field, select Remapper. For the Set attribute(s) or tag key to remap field, enter attributes.field (this is the name of the attribute Pro Custodibus uses for the name of the changed field).
For the Set target attribute or tag key field, enter wg.change.field (this is the name of the new Datadog attribute we’ll create). For the Name the processor field, enter a useful display name like “wg.change.field”. Then click the Create button:
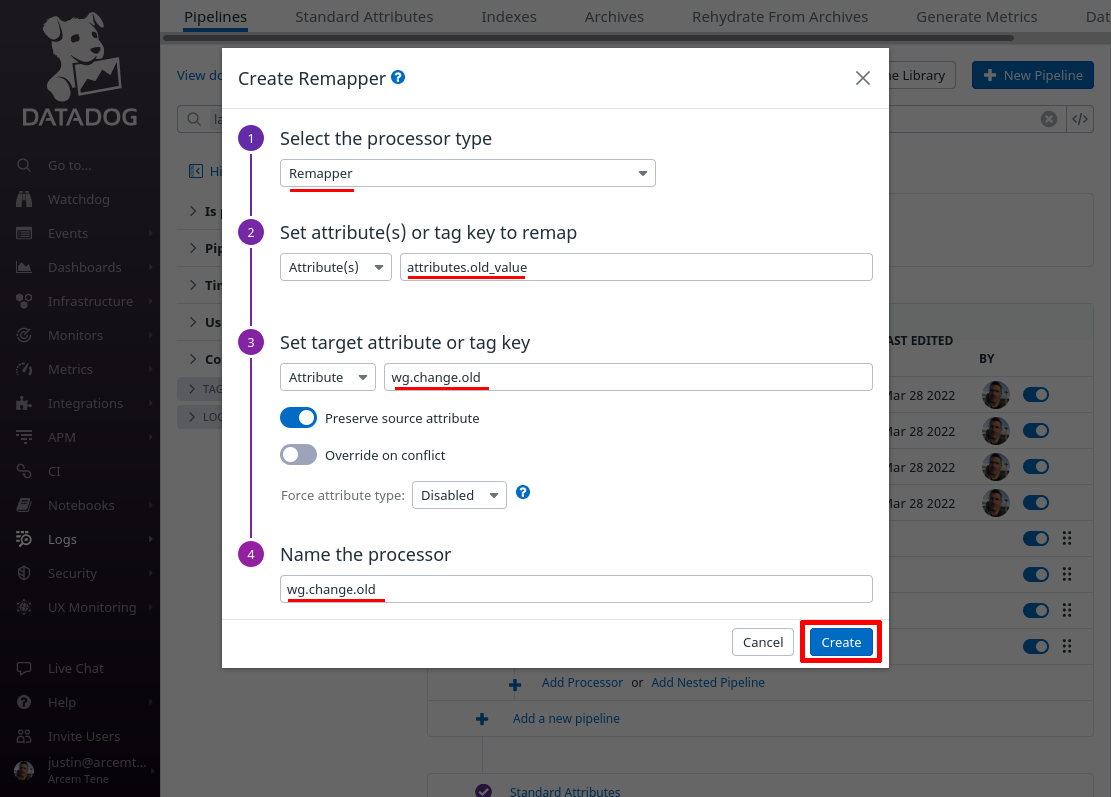
Click the Add Processor link again; this time we’ll map the attribute Pro Custodibus uses for the old value that changed.
For the Select processor type field, select Remapper. For the Set attribute(s) or tag key to remap field, enter attributes.old_value (this is the name of the attribute Pro Custodibus uses for the old value of the field that changed).
For the Set target attribute or tag key field, enter wg.change.old (this is the name of the new Datadog attribute we’ll create). For the Name the processor field, enter a useful display name like “wg.change.old”. Then click the Create button:
Click the Add Processor link again; this time we’ll map the attribute Pro Custodibus uses for the new value that changed.
For the Select processor type field, select Remapper. For the Set attribute(s) or tag key to remap field, enter attributes.new_value (this is the name of the attribute Pro Custodibus uses for the new value of the field that changed).
For the Set target attribute or tag key field, enter wg.change.new (this is the name of the new Datadog attribute we’ll create). For the Name the processor field, enter a useful display name like “wg.change.new”. Then click the Create button:

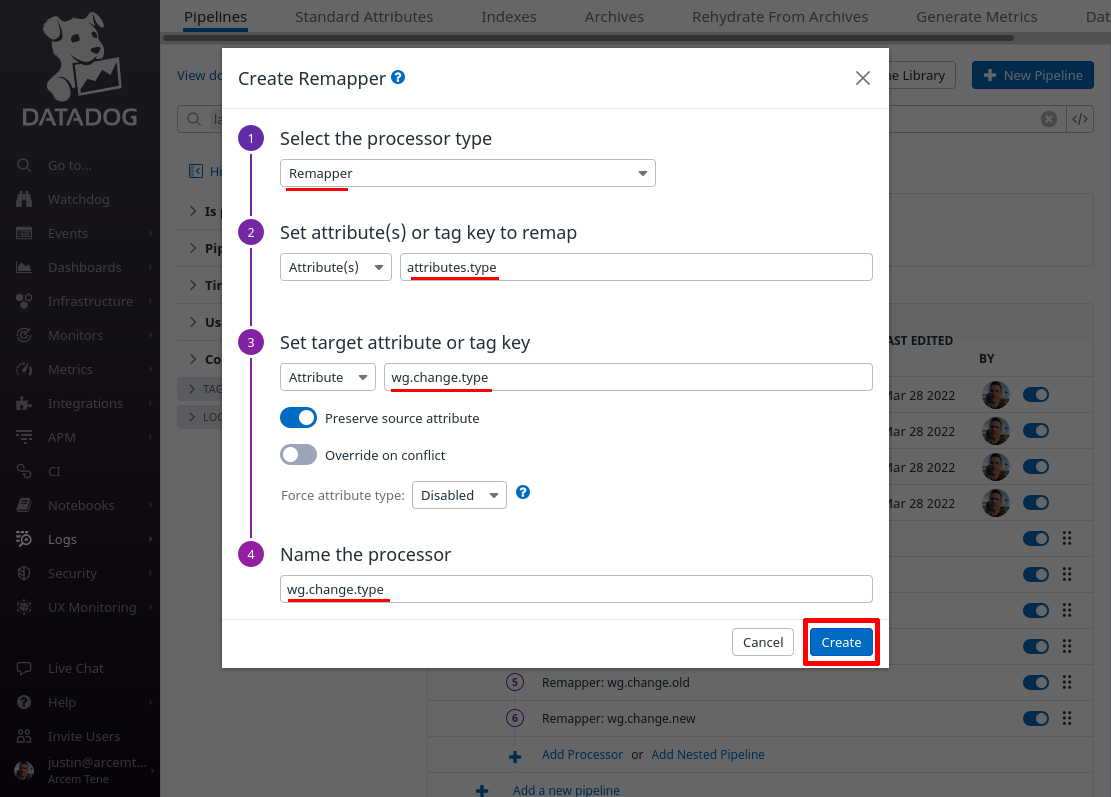
Click the Add Processor link again; this time we’ll map the attribute Pro Custodibus uses for the changed resource type.
For the Select processor type field, select Remapper. For the Set attribute(s) or tag key to remap field, enter attributes.type (this is the name of the attribute Pro Custodibus uses for the type of resource that changed).
For the Set target attribute or tag key field, enter wg.change.type (this is the name of the new Datadog attribute we’ll create). For the Name the processor field, enter a useful display name like “wg.change.type”. Then click the Create button:
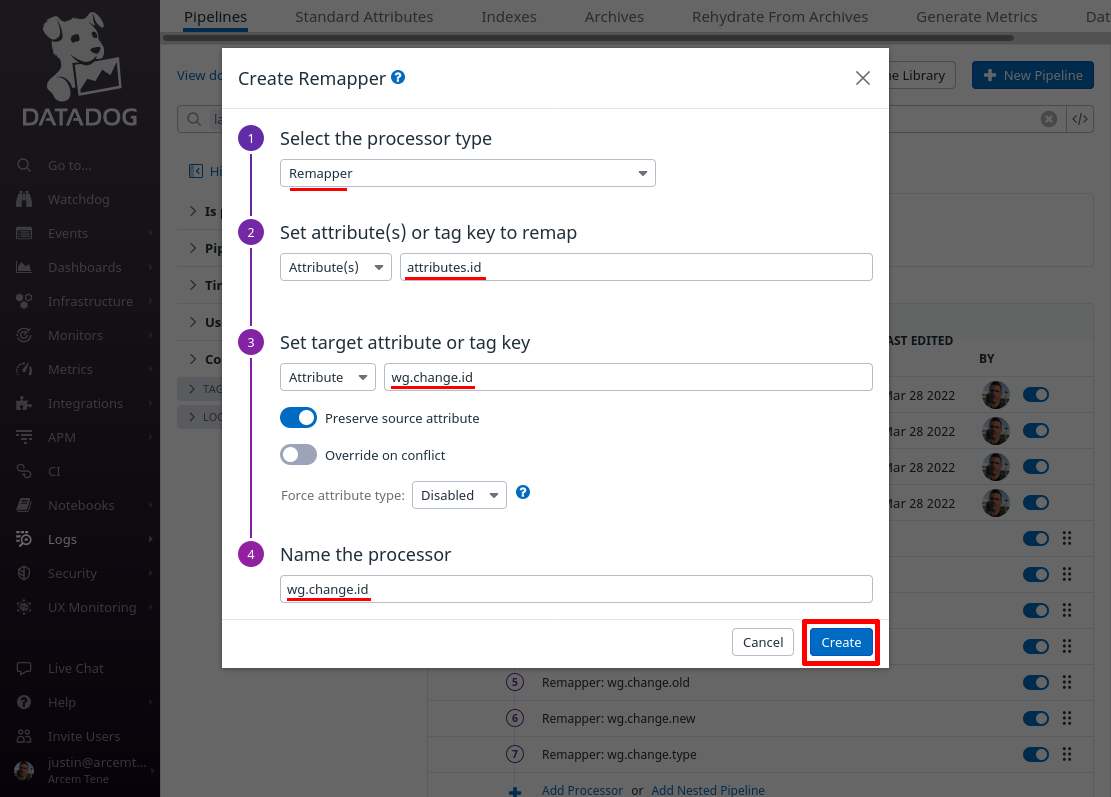
Click the Add Processor link again; this time we’ll map the attribute Pro Custodibus uses for the changed resource ID.
For the Select processor type field, select Remapper. For the Set attribute(s) or tag key to remap field, enter attributes.id (this is the name of the attribute Pro Custodibus uses for the ID of the resource that changed).
For the Set target attribute or tag key field, enter wg.change.id (this is the name of the new Datadog attribute we’ll create). For the Name the processor field, enter a useful display name like “wg.change.id”. Then click the Create button:
Click the Add Processor link one last time; finally, we’ll add a lookup mapping from the Datadog wg.change.id attribute we just created to a display name for the changed resource.
For the Select processor type field, select Lookup Processor. For the Set lookup mapping field, enter a CSV list of values like the following (for an example environment), which maps a Pro Custodibus resource ID in the first column to a display name for the resource (like a user, or a host, or an endpoint, or an agent, etc) in the second column:
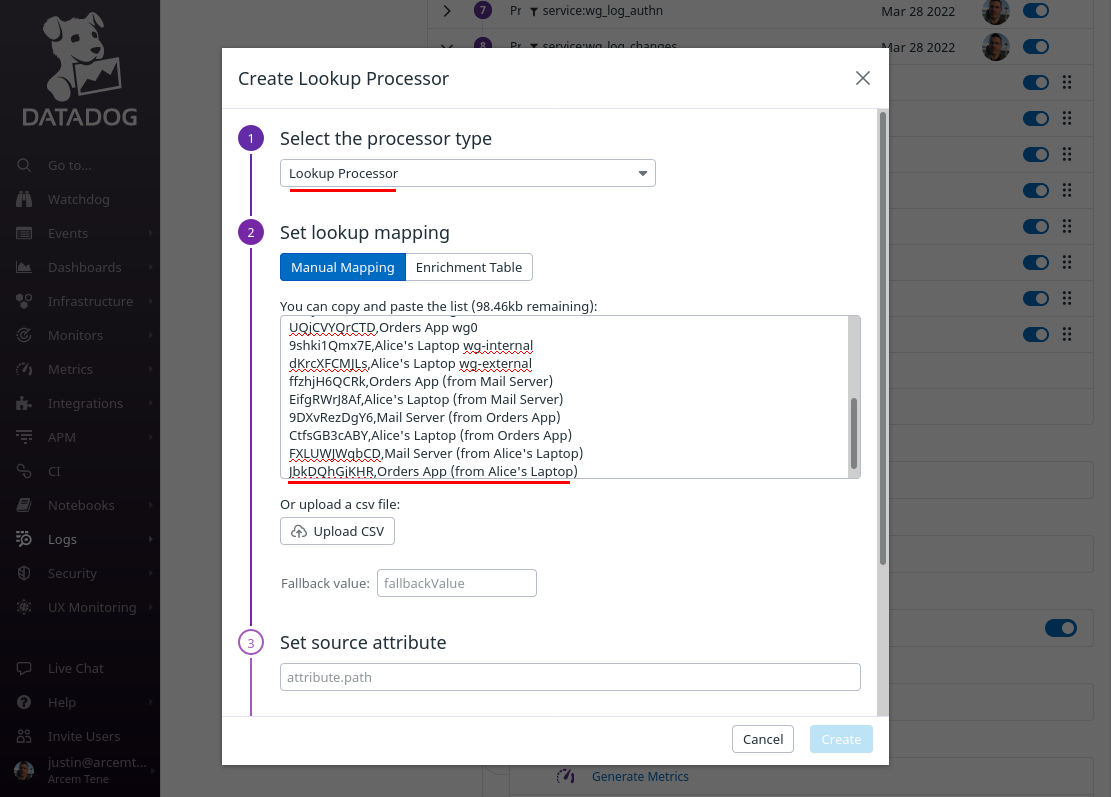
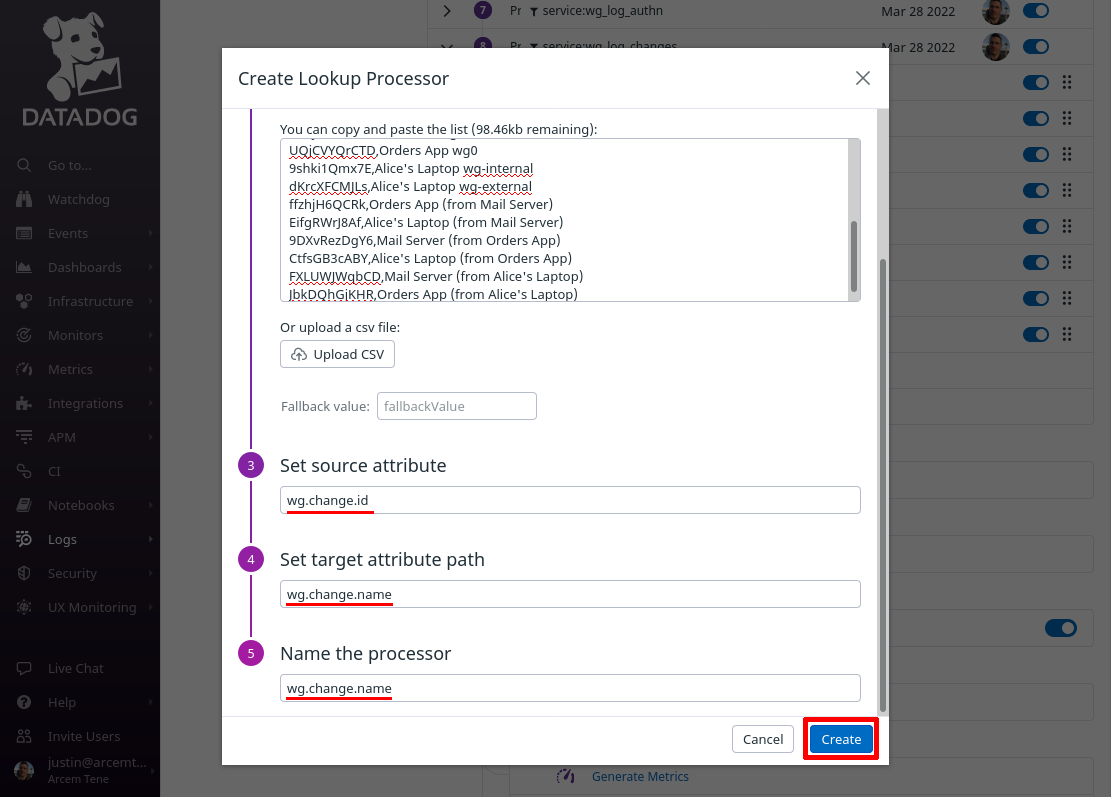
Scroll down, and for the Set source attribute field, enter wg.change.id (the first column in the CSV list will match this attribute value). For the Set target attribute path field, enter wg.change.name (this is the name of the new Datadog attribute we’ll create, using the values from the second column). For the Name the processor field, enter a useful display name like “wg.change.name”. Then click the Create button:
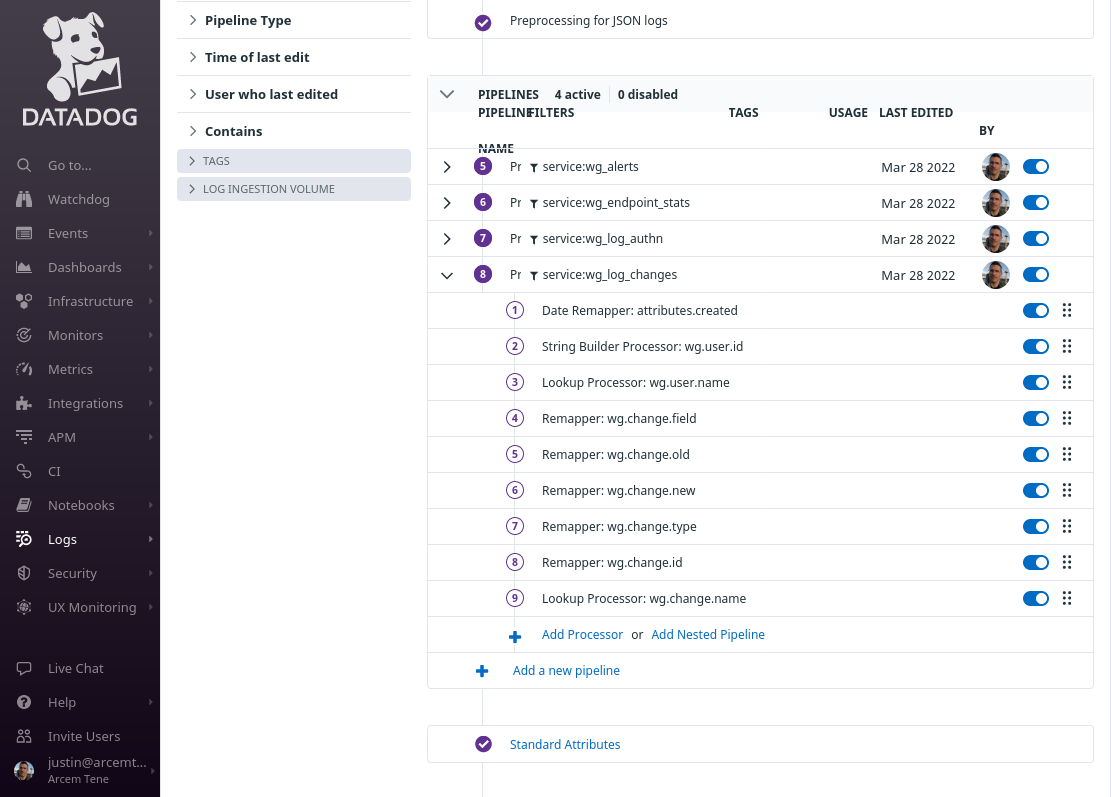
At the end of this process, your changes log pipeline should look like the following:
Set Up Datadog Log Explorer for Log Changes
Next, we’ll set up the Datadog log explorer with some useful log facets and a custom view to show our new change logs.
In the Datadog app, navigate to the Search section of the Logs area of the app:
In the facets pane on the right side of the log search page, click the Add button:
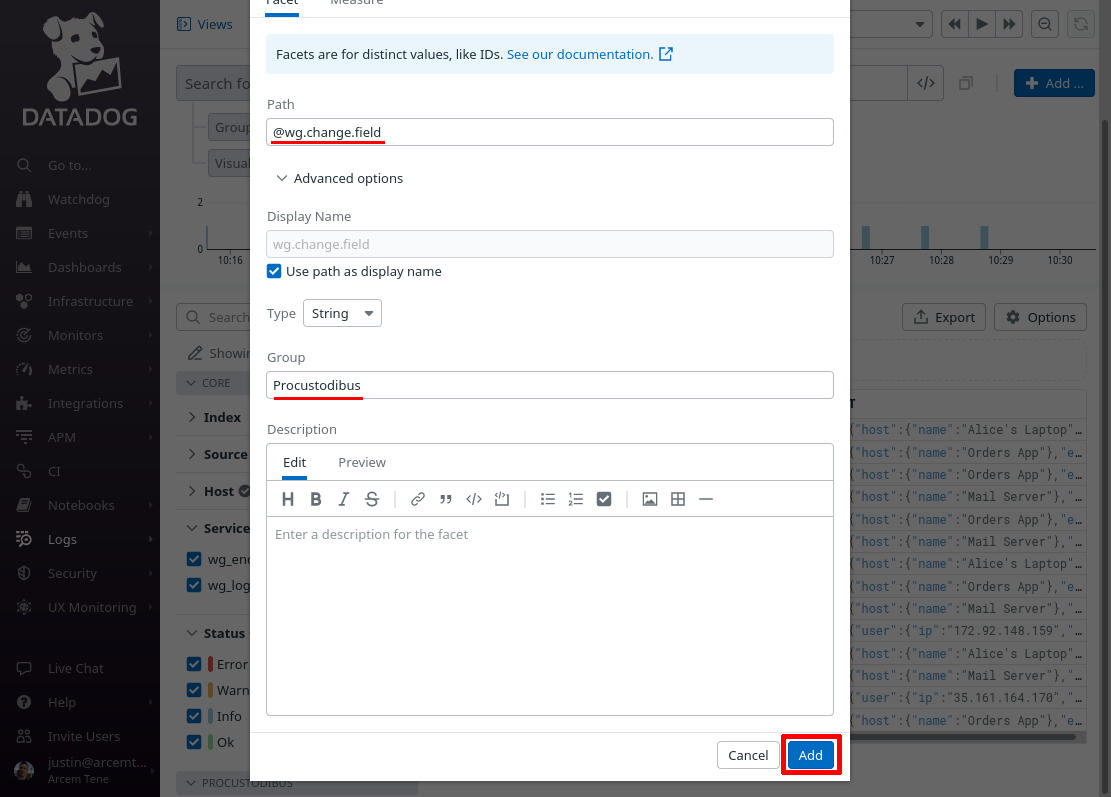
On the “Add facet” dialog, in the Path field, enter @wg.change.field (or whatever Datadog attribute you remapped from the source Pro Custodibus attributes.field attribute in the previous section). For the Group field, enter Procustodibus (or the name of some custom group that you’d rather use). Then click the Add button:
Do the same for these other attributes that we set up in the previous section:
-
wg.change.name -
wg.change.new -
wg.change.old -
wg.change.type
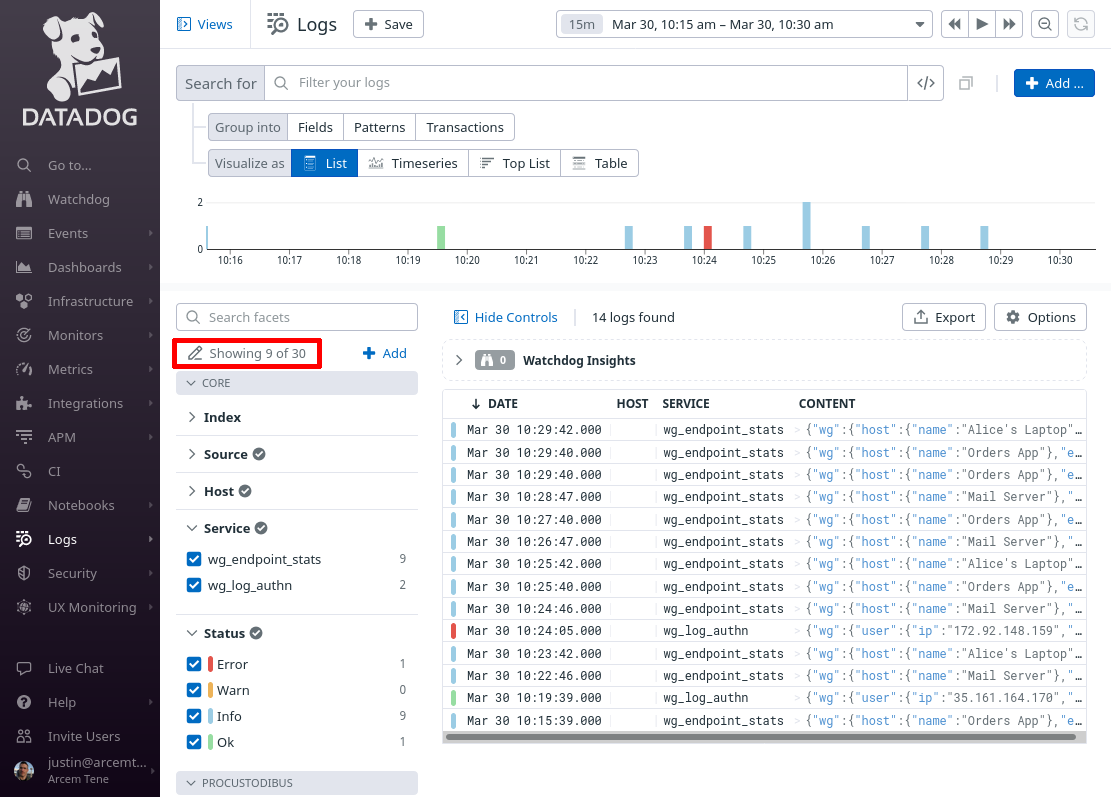
When done, click the Showing X of Y link in the facets pane:
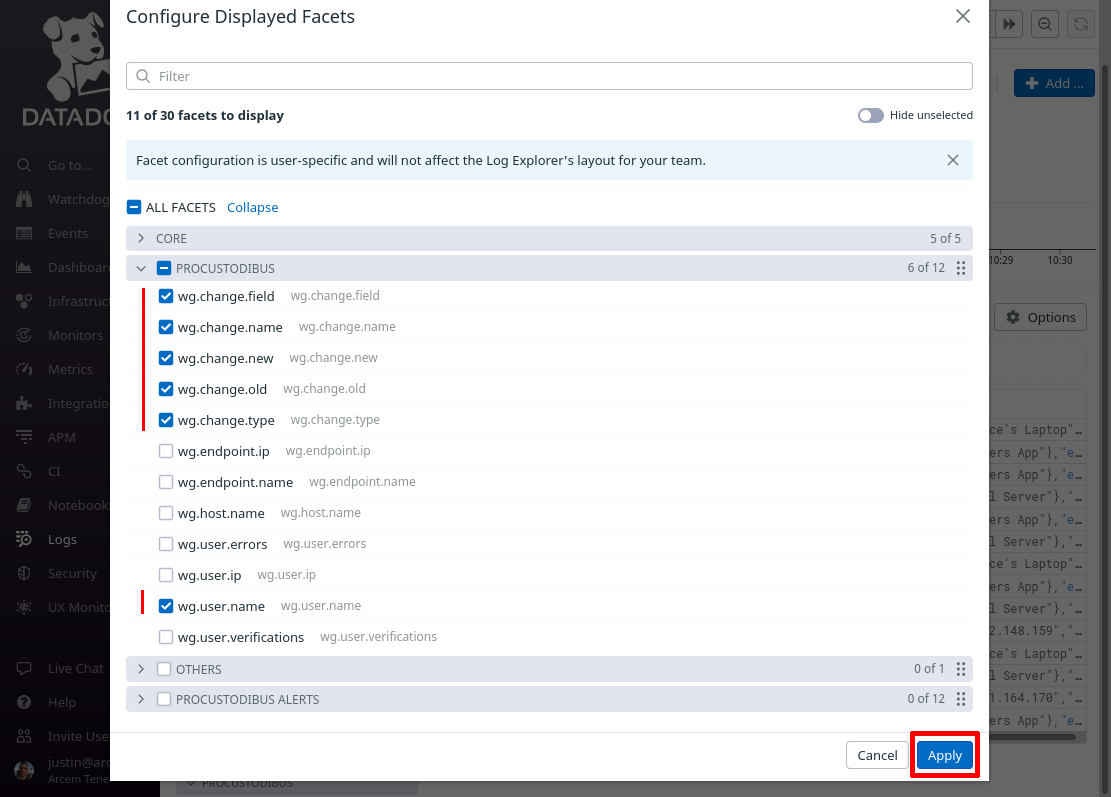
Select all the facets you just added (as well as the wg.user.name facet we added in the Set Up Datadog Log Explorer for Log Authn section), so that you can see them in the facets pane of the main log explorer page, and click the Apply button:
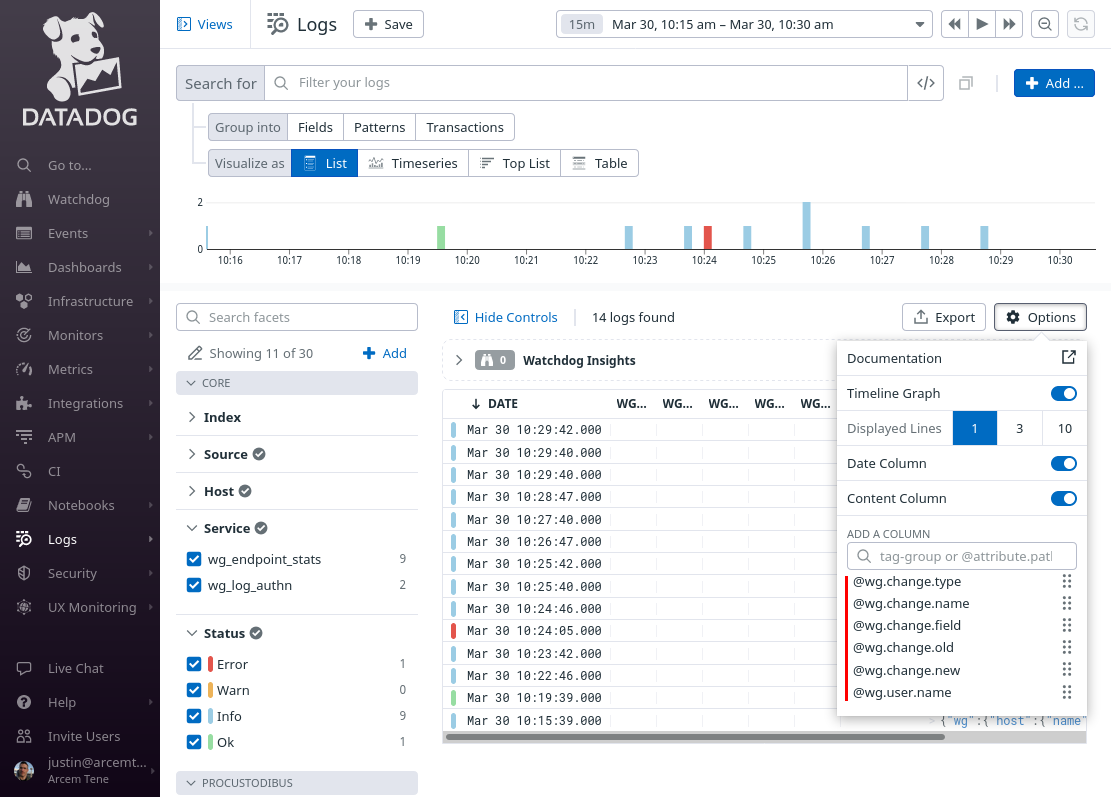
Then click the Options button above the list of log entries to customize the columns displayed in the list:
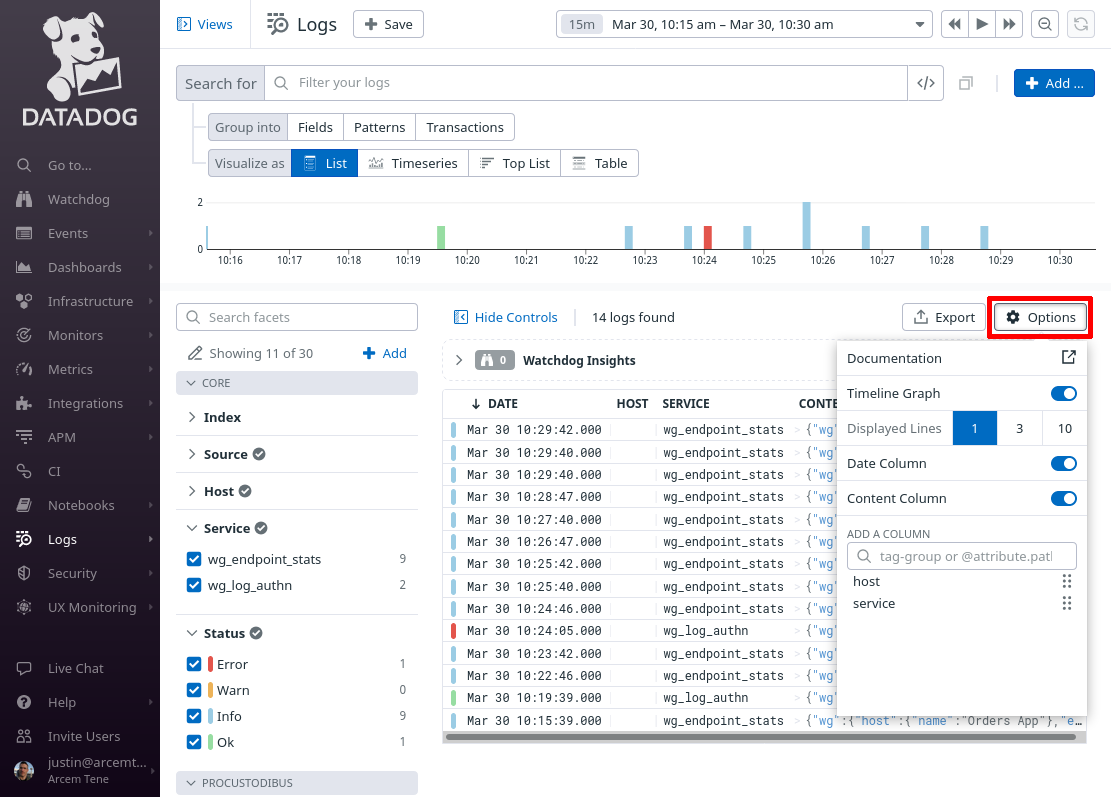
Remove the existing columns (other than Date and Content), and add the following columns:
-
wg.change.type -
wg.change.name -
wg.change.field -
wg.change.old -
wg.change.new -
wg.user.name
Change the Search for field to service:wg_log_changes, and the time range to the past day (or past week). Then click the Save button:
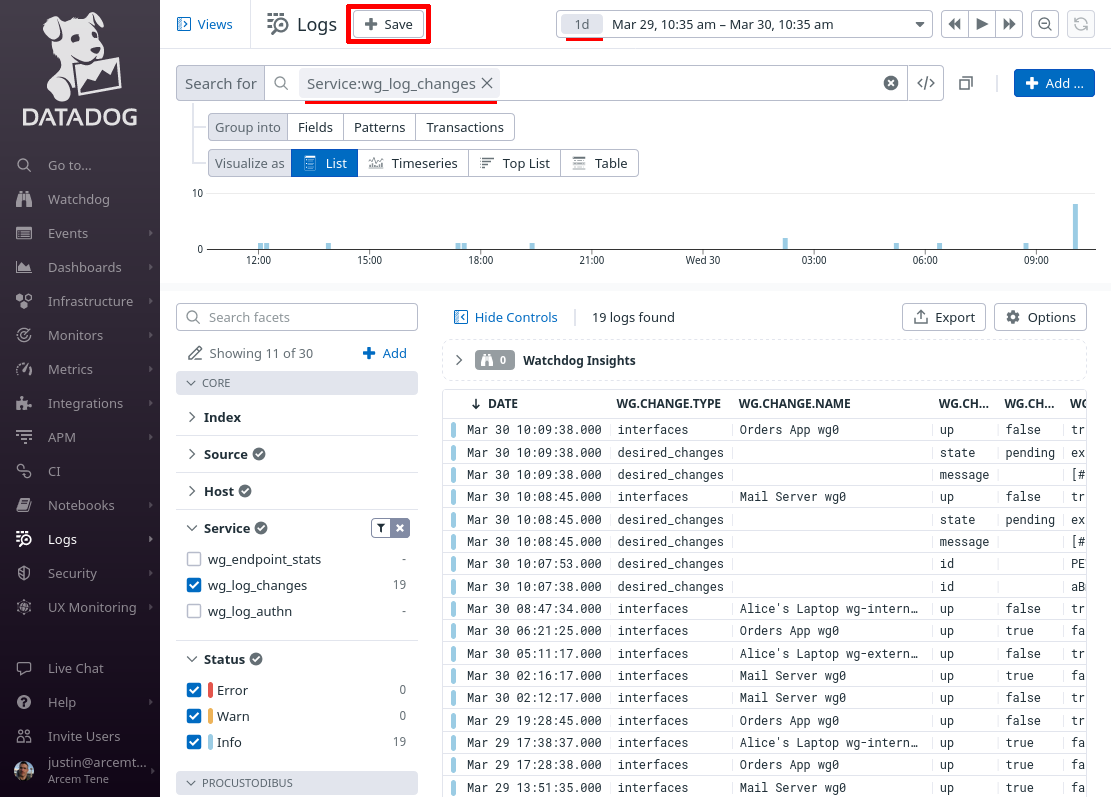
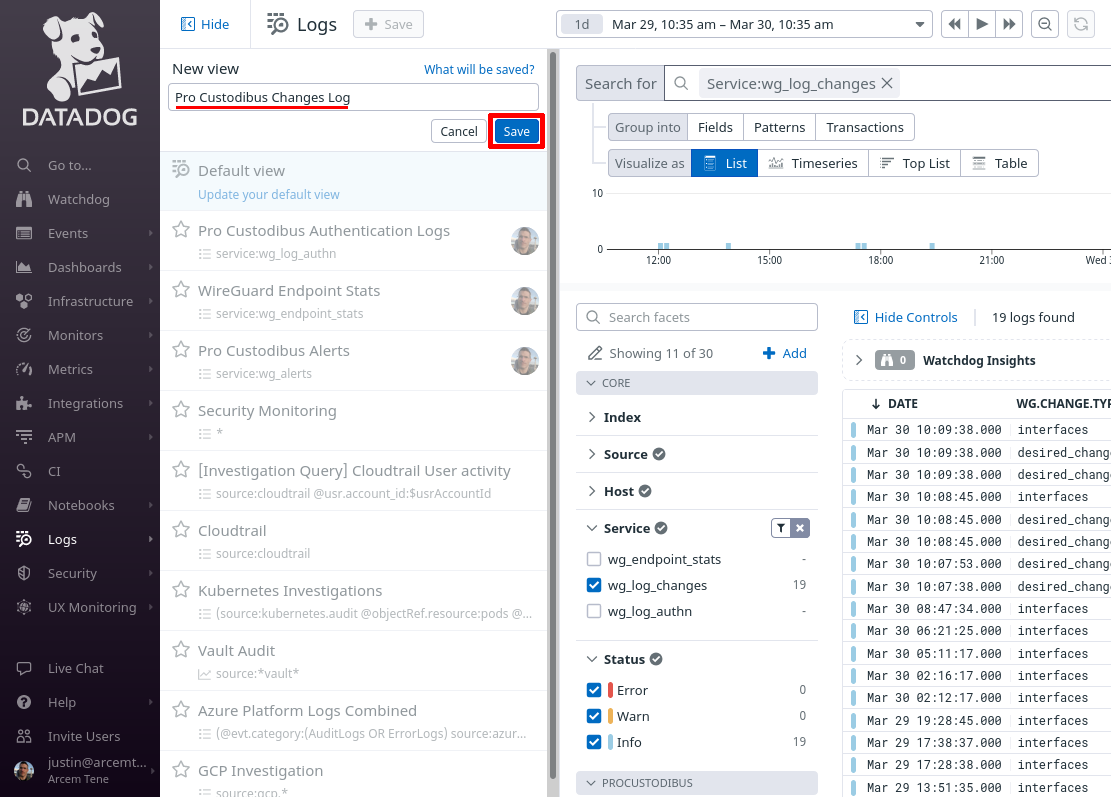
In the New view field, enter Pro Custodibus Changes Log, and click the Save button:
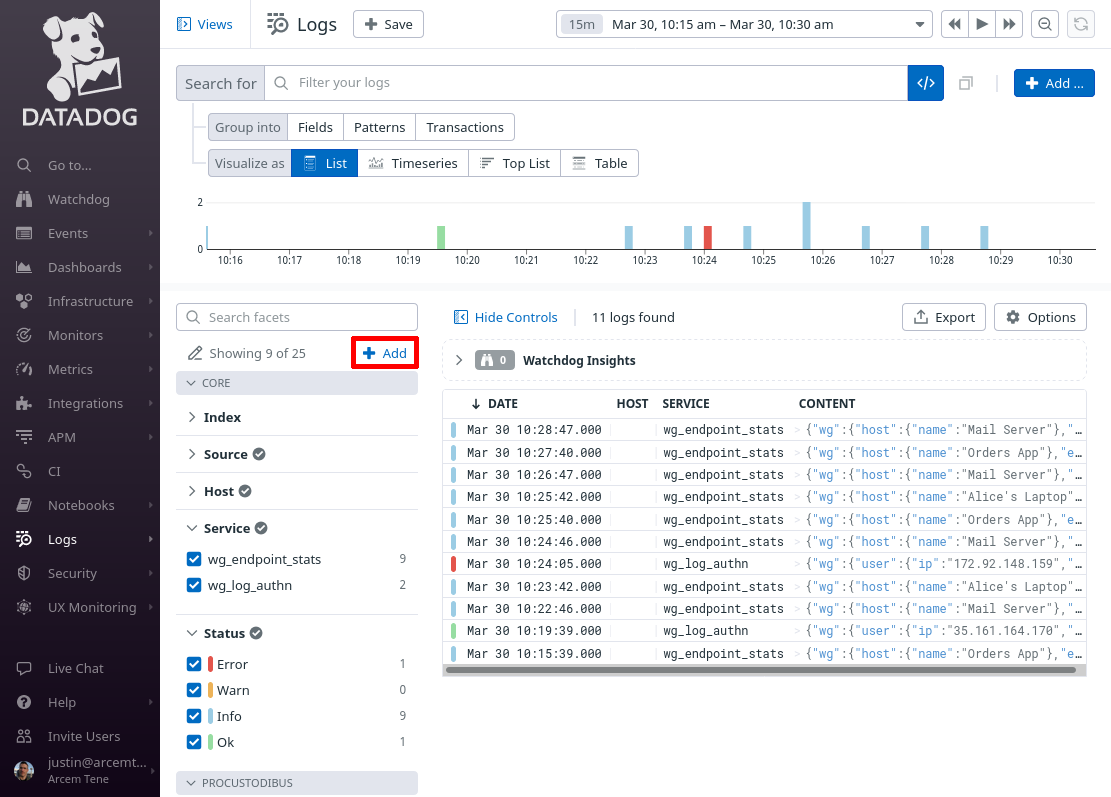
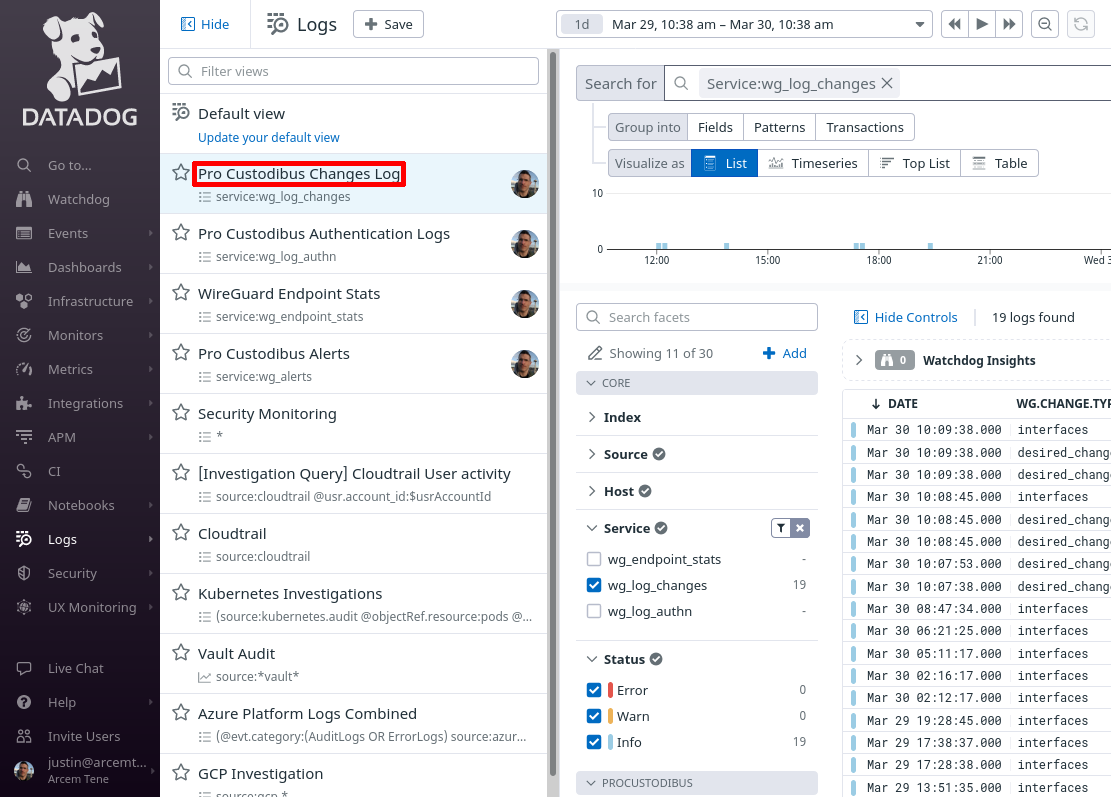
You can return to this view later to when you want to check on changes made to your WireGuard network (or other changes to your Pro Custodibus settings):
Set Up Datadog Security Detection Rules for Log Changes
Finally, we’ll set up Datadog’s Cloud SIEM with our first custom detection rule for Pro Custodibus’ change logs. We’ll set up a rule that will detect if a Pro Custodibus user has attempted to change the privilege level of another user (by changing the user’s type).
In the Datadog app, navigate to the Detection Rules section of the Security area of the app:
Click the New Rule button:
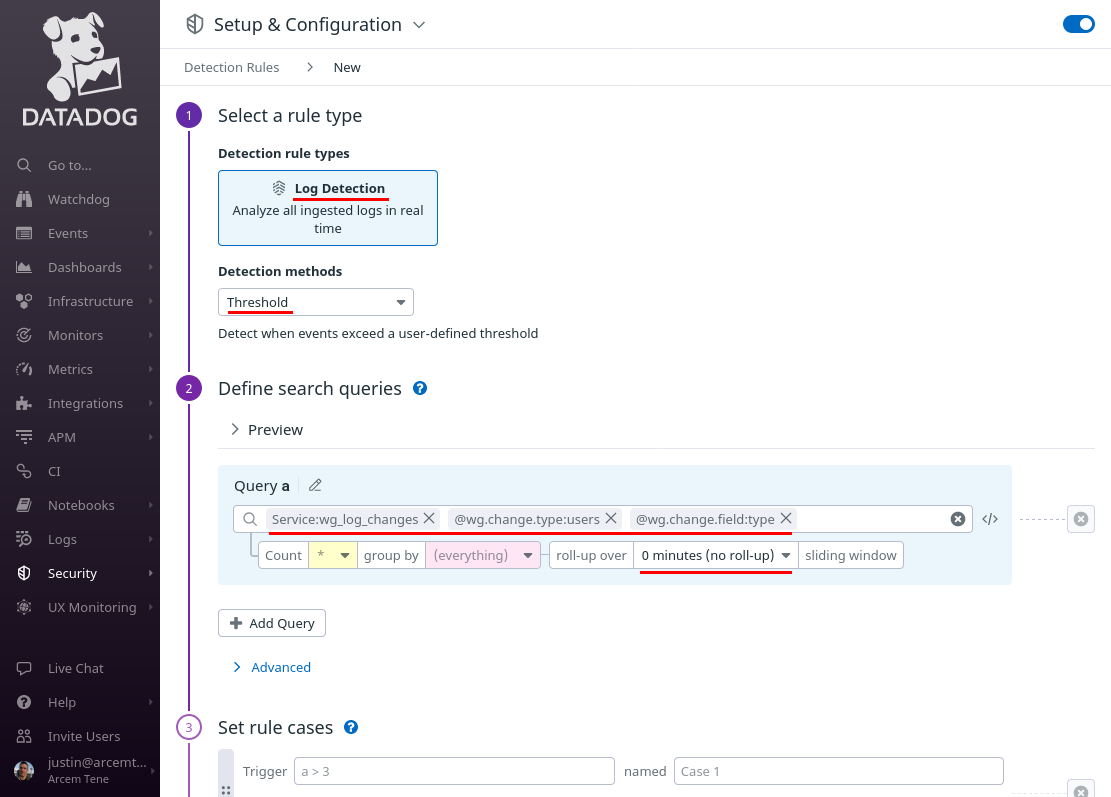
For Detection rule types, select Log Detection, and for Detection methods, select Threshold.
Then for Define search queries, enter service:wg_log_changes @wg.change.type:users @wg.change.field:type. For roll-up over, enter 0 minutes (no roll-up) (to detect every individual change):
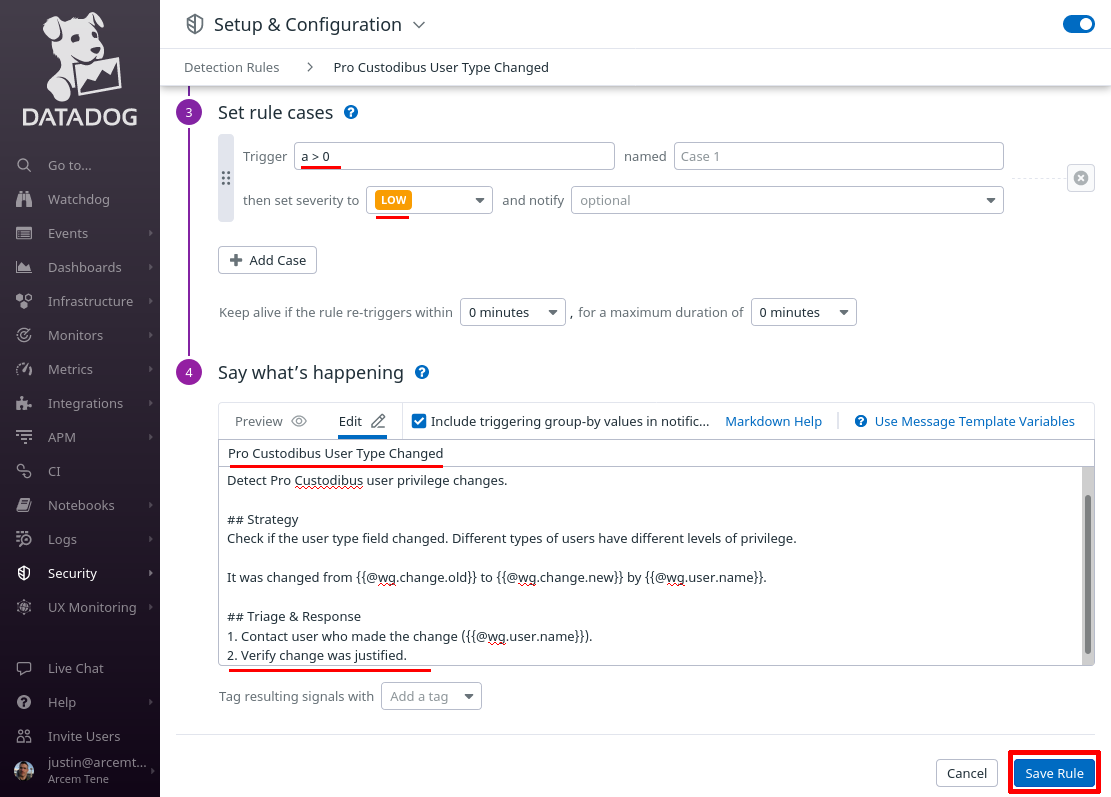
Scroll down to the “Set rule cases” section, and for Trigger, enter a > 0. Set the rest of the case fields appropriately; in this case, we’ve set severity to LOW.
In the “Say what’s happening” section, for the Rule name field, enter Pro Custodibus User Type Changed. For the Rule message field, enter some text like the following:
## Goal
Detect Pro Custodibus user privilege changes.

## Strategy
Check if the user type field changed. Different types of users have different levels of privilege.

It was changed from {{@wg.change.old}} to {{@wg.change.new}} by {{@wg.user.name}}.

## Triage & Response
1. Contact user who made the change ({{@wg.user.name}}).
2. Verify change was justified.
Finally, click the Save Rule button: