Four Ways to View WireGuard Logs
WireGuard doesn’t do any logging by default. But here are four tools you can use to generate thorough WireGuard logging for troubleshooting, analytics, SIEM (Security Information and Event Management), or incident forensics:
Dyndbg
If you use the WireGuard Linux kernel module (on kernel versions 5.6 or newer), you can turn on WireGuard’s dyndbg logging, which sends log messages to the kernel message buffer, kmsg. You can then use the standard dmesg utility to read these messages. Also, many Linux systems have a logging daemon like rsyslogd or journald that automatically captures and stores these messages.
First, enable WireGuard dyndbg logging with the following commands:
# modprobe wireguard
# echo module wireguard +p > /sys/kernel/debug/dynamic_debug/control
Note that when running this via sudo instead of as the root user, you need to use tee to pipe the dyndbg command into the control file, like so:
$ sudo modprobe wireguard
$ echo module wireguard +p | sudo tee /sys/kernel/debug/dynamic_debug/control
Once you do that, you’ll be able to see WireGuard log messages in the kernel message facility, if your system is set up with rsyslogd, journald, or a similar logging daemon. With rsyslogd, check the /var/log/kern.log or /var/log/messages file. With journald, run journalctl -ek.
To capture these messages in their own log file, you can “tail” them with the dmesg command’s -w (follow) flag:
# touch /var/log/wireguard-dyndbg.log
# dmesg -wT | grep wireguard' >> /var/log/wireguard-dyndbg.log
(The -T flag adds timestamps to these messages.)
This is the logging you’ll see when the WireGuard module is initialized, and when the WireGuard interface starts up:
[Sat Mar  6 20:13:23 2021] wireguard: WireGuard 1.0.20201112 loaded. See www.wireguard.com for information.
[Sat Mar  6 20:13:23 2021] wireguard: Copyright (C) 2015-2019 Jason A. Donenfeld <Jason@zx2c4.com>. All Rights Reserved.
[Sat Mar  6 20:35:33 2021] wireguard: wg0: Interface created
[Sat Mar  6 20:35:33 2021] wireguard: wg0: Peer 1 created
And you’ll see logging like this for each WireGuard handshake:
[Sat Mar  6 20:45:15 2021] wireguard: wg0: Receiving handshake initiation from peer 1 (203.0.113.2:51820)
[Sat Mar  6 20:45:15 2021] wireguard: wg0: Sending handshake response to peer 1 (203.0.113.2:51820)
[Sat Mar  6 20:45:15 2021] wireguard: wg0: Keypair 1 created for peer 1
[Sat Mar  6 20:45:25 2021] wireguard: wg0: Receiving keepalive packet from peer 1 (203.0.113.2:51820)
And you’ll see logging like this after a peer has been inactive for a while:
[Sat Mar  6 20:57:19 2021] wireguard: wg0: Zeroing out all keys for peer 1 (203.0.113.2:51820), since we haven't received a new one in 540 seconds
[Sat Mar  6 20:57:19 2021] wireguard: wg0: Keypair 1 destroyed for peer 1
Peers will be numbered in the order added since the WireGuard module was loaded. This can make identifying peers difficult, particularly if you have multiple WireGuard interfaces, or if you ever bring an interface down and up (or otherwise change the configuration for a peer).
But you can at least use this logging to track which external IP addresses are connecting to your WireGuard network. The IP address and port following the peer in the output indicates the peer’s current remote IP address and port (aka its endpoint). In the above output, peer 1 has an endpoint of 203.0.113.2:51820.
You can also use this logging to track rejected connection attempts. You’ll see a message like this when a peer tries to connect, but fails authentication:
[Sat Mar 6 20:41:31 2021] wireguard: wg0: Invalid handshake initiation from 203.0.113.2:51820And a message like this when a peer tries to send an unauthorized packet through the tunnel:
[Sat Mar 6 20:43:04 2021] wireguard: wg0: Packet has unallowed src IP (10.0.0.3) from peer 1 (203.0.113.2:51820)You can turn this logging off by piping the same command into the dyndbg control file as above, replacing the +p flag with the -p flag:
# echo module wireguard -p > /sys/kernel/debug/dynamic_debug/controlTcpdump
Tcpdump allows you to log each individual packet that’s sent to and from WireGuard. You can install it via the tcpdump package on most flavors of Linux. To log the headers of the wrapper UDP packets carrying WireGuard encrypted content, run it like the following (where 51820 is the ListenPort in your WireGuard config):
# touch /var/log/wireguard-tcpdump.log
# tcpdump -ttttni any 'udp port 51820' >> /var/log/wireguard-tcpdump.log
(The -tttt flag adds the date to the timestamp; the -n flag skips hostname lookups; and the -i any flag includes all interfaces.)
This will allow you to track the remote IP addresses that are connecting to your local WireGuard interface. A WireGuard handshake and short encrypted HTTP request and response will look like this:
2021-03-06 20:45:15.829578 IP 203.0.113.2.51820 > 198.51.100.1.51820: UDP, length 148
2021-03-06 20:45:15.830338 IP 198.51.100.1.51820 > 203.0.113.2.51820: UDP, length 92
2021-03-06 20:45:15.831375 IP 203.0.113.2.51820 > 198.51.100.1.51820: UDP, length 96
2021-03-06 20:45:15.831457 IP 198.51.100.1.51820 > 203.0.113.2.51820: UDP, length 96
2021-03-06 20:45:15.832152 IP 203.0.113.2.51820 > 198.51.100.1.51820: UDP, length 96
2021-03-06 20:45:15.832173 IP 203.0.113.2.51820 > 198.51.100.1.51820: UDP, length 176
2021-03-06 20:45:15.832245 IP 198.51.100.1.51820 > 203.0.113.2.51820: UDP, length 96
2021-03-06 20:45:15.833497 IP 198.51.100.1.51820 > 203.0.113.2.51820: UDP, length 240
2021-03-06 20:45:15.833610 IP 198.51.100.1.51820 > 203.0.113.2.51820: UDP, length 384
2021-03-06 20:45:15.834184 IP 203.0.113.2.51820 > 198.51.100.1.51820: UDP, length 96
2021-03-06 20:45:15.834412 IP 203.0.113.2.51820 > 198.51.100.1.51820: UDP, length 96
2021-03-06 20:45:15.834463 IP 198.51.100.1.51820 > 203.0.113.2.51820: UDP, length 96
In the above output, 198.51.100.1 is the IP address of the ethernet interface on the local host, and 203.0.113.2 is the IP address of the remote WireGuard endpoint (the remote endpoint is also listening on port 51820, but the above command would capture similar output even if the remote endpoint was on some other port). The address listed first is the packet’s source, and the second is its destination.
You can tune how much info to include on each line via -v (verbose) and -e (link-level header) flags. The above is the quietest version. Here’s what the most verbose version looks like:
# tcpdump -evvvttttni any 'udp port 51820'
2021-03-06 22:39:55.835971  In 06:01:1a:2a:77:f7 ethertype IPv4 (0x0800), length 192: (tos 0x88, ttl 64, id 59094, offset 0, flags [none], proto UDP (17), length 176)
    203.0.113.2.51820 > 198.51.100.1.51820: [udp sum ok] UDP, length 148
2021-03-06 22:39:55.836701 Out 06:24:d3:09:8d:9b ethertype IPv4 (0x0800), length 136: (tos 0x88, ttl 64, id 43866, offset 0, flags [none], proto UDP (17), length 120)
    198.51.100.1.51820 > 203.0.113.2.51820: [bad udp cksum 0x1896 -> 0x2b0a!] UDP, length 92
2021-03-06 22:39:55.837752  In 06:01:1a:2a:77:f7 ethertype IPv4 (0x0800), length 140: (tos 0x0, ttl 64, id 59095, offset 0, flags [none], proto UDP (17), length 124)
    203.0.113.2.51820 > 198.51.100.1.51820: [udp sum ok] UDP, length 96
2021-03-06 22:39:55.837869 Out 06:24:d3:09:8d:9b ethertype IPv4 (0x0800), length 140: (tos 0x0, ttl 64, id 43867, offset 0, flags [none], proto UDP (17), length 124)
    198.51.100.1.51820 > 203.0.113.2.51820: [bad udp cksum 0x189a -> 0xdf5f!] UDP, length 96
2021-03-06 22:39:55.838587  In 06:01:1a:2a:77:f7 ethertype IPv4 (0x0800), length 140: (tos 0x0, ttl 64, id 59096, offset 0, flags [none], proto UDP (17), length 124)
    203.0.113.2.51820 > 198.51.100.1.51820: [udp sum ok] UDP, length 96
2021-03-06 22:39:55.838618  In 06:01:1a:2a:77:f7 ethertype IPv4 (0x0800), length 220: (tos 0x0, ttl 64, id 59097, offset 0, flags [none], proto UDP (17), length 204)
    203.0.113.2.51820 > 198.51.100.1.51820: [udp sum ok] UDP, length 176
2021-03-06 22:39:55.838748 Out 06:24:d3:09:8d:9b ethertype IPv4 (0x0800), length 140: (tos 0x0, ttl 64, id 43868, offset 0, flags [none], proto UDP (17), length 124)
    198.51.100.1.51820 > 203.0.113.2.51820: [bad udp cksum 0x189a -> 0x906d!] UDP, length 96
2021-03-06 22:39:55.839637 Out 06:24:d3:09:8d:9b ethertype IPv4 (0x0800), length 284: (tos 0x0, ttl 64, id 43869, offset 0, flags [none], proto UDP (17), length 268)
    198.51.100.1.51820 > 203.0.113.2.51820: [bad udp cksum 0x192a -> 0x369a!] UDP, length 240
2021-03-06 22:39:55.839693 Out 06:24:d3:09:8d:9b ethertype IPv4 (0x0800), length 428: (tos 0x0, ttl 64, id 43870, offset 0, flags [none], proto UDP (17), length 412)
    198.51.100.1.51820 > 203.0.113.2.51820: [bad udp cksum 0x19ba -> 0xbcd9!] UDP, length 384
2021-03-06 22:39:55.840335  In 06:01:1a:2a:77:f7 ethertype IPv4 (0x0800), length 140: (tos 0x0, ttl 64, id 59098, offset 0, flags [none], proto UDP (17), length 124)
    203.0.113.2.51820 > 198.51.100.1.51820: [udp sum ok] UDP, length 96
2021-03-06 22:39:55.840435  In 06:01:1a:2a:77:f7 ethertype IPv4 (0x0800), length 140: (tos 0x0, ttl 64, id 59099, offset 0, flags [none], proto UDP (17), length 124)
    203.0.113.2.51820 > 198.51.100.1.51820: [udp sum ok] UDP, length 96
2021-03-06 22:39:55.840496 Out 06:24:d3:09:8d:9b ethertype IPv4 (0x0800), length 140: (tos 0x0, ttl 64, id 43871, offset 0, flags [none], proto UDP (17), length 124)
    198.51.100.1.51820 > 203.0.113.2.51820: [bad udp cksum 0x189a -> 0x61d5!] UDP, length 96
To save tcpdump output in raw pcap format, use the -w flag:
# tcpdump -i any 'udp port 51820' -G 86400 -w /var/log/wireguard-tcpdump.pcap(The -G 86400 flag will rotate this file once a day.)
You can view these .pcap files with tcpdump itself, using the -r flag, or with other analysis tools, such as Wireshark.
You can also use tcpdump to log the packets that are sent inside the WireGuard tunnel. Run it like the following to log packet headers sent through the tunnel (where wg0 is the name of your WireGuard interface):
# touch /var/log/wireguard-tunnel-tcpdump.log
# tcpdump -ttttni wg0 >> /var/log/wireguard-tunnel-tcpdump.log
This will allow you to track exactly what is being sent through your WireGuard virtual private network. The short HTTP request and response from above will look like this when logging the packets within the tunnel:
2021-03-06 20:45:15.831399 IP 10.0.0.2.34770 > 10.0.0.1.8080: Flags [S], seq 2745122483, win 62167, options [mss 8881,sackOK,TS val 3110592290 ecr 0,nop,wscale 6], length 0
2021-03-06 20:45:15.831425 IP 10.0.0.1.8080 > 10.0.0.2.34770: Flags [S.], seq 586324343, ack 2745122484, win 62083, options [mss 8881,sackOK,TS val 1651797146 ecr 3110592290,nop,wscale 6], length 0
2021-03-06 20:45:15.832176 IP 10.0.0.2.34770 > 10.0.0.1.8080: Flags [.], ack 1, win 972, options [nop,nop,TS val 3110592293 ecr 1651797146], length 0
2021-03-06 20:45:15.832214 IP 10.0.0.2.34770 > 10.0.0.1.8080: Flags [P.], seq 1:78, ack 1, win 972, options [nop,nop,TS val 3110592293 ecr 1651797146], length 77: HTTP: GET / HTTP/1.1
2021-03-06 20:45:15.832227 IP 10.0.0.1.8080 > 10.0.0.2.34770: Flags [.], ack 78, win 969, options [nop,nop,TS val 1651797147 ecr 3110592293], length 0
2021-03-06 20:45:15.833466 IP 10.0.0.1.8080 > 10.0.0.2.34770: Flags [P.], seq 1:155, ack 78, win 969, options [nop,nop,TS val 1651797148 ecr 3110592293], length 154: HTTP: HTTP/1.0 200 OK
2021-03-06 20:45:15.833593 IP 10.0.0.1.8080 > 10.0.0.2.34770: Flags [FP.], seq 155:452, ack 78, win 969, options [nop,nop,TS val 1651797148 ecr 3110592293], length 297: HTTP
2021-03-06 20:45:15.834212 IP 10.0.0.2.34770 > 10.0.0.1.8080: Flags [.], ack 155, win 970, options [nop,nop,TS val 3110592295 ecr 1651797148], length 0
2021-03-06 20:45:15.834428 IP 10.0.0.2.34770 > 10.0.0.1.8080: Flags [F.], seq 78, ack 453, win 966, options [nop,nop,TS val 3110592295 ecr 1651797148], length 0
2021-03-06 20:45:15.834447 IP 10.0.0.1.8080 > 10.0.0.2.34770: Flags [.], ack 79, win 969, options [nop,nop,TS val 1651797149 ecr 3110592295], length 0
In the above output, the IP address of local WireGuard interface is 10.0.0.1, and the IP address of the remote WireGuard peer is 10.0.0.2. An HTTP server is running on port 8080 of the local host, which the remote host is connecting to through the WireGuard tunnel (using the ephemeral TCP port 34770 inside the tunnel). Tcpdump includes the HTTP request and response status lines in its output (GET / HTTP 1.1 and HTTP/1.0 200 OK at the end of lines 4 and 6).
You can use the tcpdump logging on UDP port 51820 (the first example) to keep track of the external IP addresses that are connecting to your WireGuard network; and the tcpdump logging on the wg0 interface (the last example) to track which peers are using your network (and what they’re accessing inside the network).
Iptables
Similar to tcpdump, the LOG target of iptables allows you to log each packet that’s sent to and from WireGuard. Most Linux systems use iptables, or its newer sibling nftables, to define their firewall.
If you’re using iptables, you can run the following commands to add iptables rules that will log the header info of IPv4 packets carrying WireGuard encrypted content (where 51820 is the ListenPort in your WireGuard config):
# iptables -I INPUT -p udp --dport 51820 -j LOG --log-prefix 'wireguard iptables: ' --log-level 7
# iptables -I OUTPUT -p udp --sport 51820 -j LOG --log-prefix 'wireguard iptables: ' --log-level 7
If you’re using IPv6 networking, replace iptables with ip6tables; or if you’re using both IPv4 and IPv6, run both variants.
Once you do that, you’ll be able to see WireGuard packets logged to the kernel message buffer. If your system is set up with rsyslogd, journald, or a similar logging daemon, you can use it to see this logging. With rsyslogd, check the /var/log/kern.log or /var/log/messages file. With journald, run journalctl -ek.
To capture this logging to its own file, you can “tail” these messages via the dmesg command’s -w (follow) flag:
# touch /var/log/wireguard-iptables.log
# dmesg -wT | grep 'wireguard iptables:' >> /var/log/wireguard-iptables.log
This will allow you to track the remote IP addresses that are connecting to your local WireGuard interface. A WireGuard handshake and short encrypted HTTP request and response will look like this:
[Sat Mar  6 20:45:15 2021] wireguard iptables: IN=eth0 OUT= MAC=06:24:d3:09:8d:9b:06:01:1a:2a:77:f7:08:00 SRC=203.0.113.2 DST=198.51.100.1 LEN=176 TOS=0x08 PREC=0x80 TTL=64 ID=39062 PROTO=UDP SPT=51820 DPT=51820 LEN=156
[Sat Mar  6 20:45:15 2021] wireguard iptables: IN= OUT=eth0 SRC=198.51.100.1 DST=203.0.113.2 LEN=120 TOS=0x08 PREC=0x80 TTL=64 ID=48534 PROTO=UDP SPT=51820 DPT=51820 LEN=100
[Sat Mar  6 20:45:15 2021] wireguard iptables: IN=eth0 OUT= MAC=06:24:d3:09:8d:9b:06:01:1a:2a:77:f7:08:00 SRC=203.0.113.2 DST=198.51.100.1 LEN=124 TOS=0x00 PREC=0x00 TTL=64 ID=39063 PROTO=UDP SPT=51820 DPT=51820 LEN=104
[Sat Mar  6 20:45:15 2021] wireguard iptables: IN= OUT=eth0 SRC=198.51.100.1 DST=203.0.113.2 LEN=124 TOS=0x00 PREC=0x00 TTL=64 ID=48535 PROTO=UDP SPT=51820 DPT=51820 LEN=104
[Sat Mar  6 20:45:15 2021] wireguard iptables: IN=eth0 OUT= MAC=06:24:d3:09:8d:9b:06:01:1a:2a:77:f7:08:00 SRC=203.0.113.2 DST=198.51.100.1 LEN=124 TOS=0x00 PREC=0x00 TTL=64 ID=39064 PROTO=UDP SPT=51820 DPT=51820 LEN=104
[Sat Mar  6 20:45:15 2021] wireguard iptables: IN=eth0 OUT= MAC=06:24:d3:09:8d:9b:06:01:1a:2a:77:f7:08:00 SRC=203.0.113.2 DST=198.51.100.1 LEN=204 TOS=0x00 PREC=0x00 TTL=64 ID=39065 PROTO=UDP SPT=51820 DPT=51820 LEN=184
[Sat Mar  6 20:45:15 2021] wireguard iptables: IN= OUT=eth0 SRC=198.51.100.1 DST=203.0.113.2 LEN=124 TOS=0x00 PREC=0x00 TTL=64 ID=48536 PROTO=UDP SPT=51820 DPT=51820 LEN=104
[Sat Mar  6 20:45:15 2021] wireguard iptables: IN= OUT=eth0 SRC=198.51.100.1 DST=203.0.113.2 LEN=268 TOS=0x00 PREC=0x00 TTL=64 ID=48537 PROTO=UDP SPT=51820 DPT=51820 LEN=248
[Sat Mar  6 20:45:15 2021] wireguard iptables: IN= OUT=eth0 SRC=198.51.100.1 DST=203.0.113.2 LEN=412 TOS=0x00 PREC=0x00 TTL=64 ID=48538 PROTO=UDP SPT=51820 DPT=51820 LEN=392
[Sat Mar  6 20:45:15 2021] wireguard iptables: IN=eth0 OUT= MAC=06:24:d3:09:8d:9b:06:01:1a:2a:77:f7:08:00 SRC=203.0.113.2 DST=198.51.100.1 LEN=124 TOS=0x00 PREC=0x00 TTL=64 ID=39066 PROTO=UDP SPT=51820 DPT=51820 LEN=104
[Sat Mar  6 20:45:15 2021] wireguard iptables: IN=eth0 OUT= MAC=06:24:d3:09:8d:9b:06:01:1a:2a:77:f7:08:00 SRC=203.0.113.2 DST=198.51.100.1 LEN=124 TOS=0x00 PREC=0x00 TTL=64 ID=39067 PROTO=UDP SPT=51820 DPT=51820 LEN=104
[Sat Mar  6 20:45:15 2021] wireguard iptables: IN= OUT=eth0 SRC=198.51.100.1 DST=203.0.113.2 LEN=124 TOS=0x00 PREC=0x00 TTL=64 ID=48539 PROTO=UDP SPT=51820 DPT=51820 LEN=104
[Sat Mar  6 20:45:25 2021] wireguard iptables: IN=eth0 OUT= MAC=06:24:d3:09:8d:9b:06:01:1a:2a:77:f7:08:00 SRC=203.0.113.2 DST=198.51.100.1 LEN=60 TOS=0x00 PREC=0x00 TTL=64 ID=39108 PROTO=UDP SPT=51820 DPT=51820 LEN=40
In the above output, 198.51.100.1 is the IP address of the ethernet interface on the local host, and 203.0.113.2 is the IP address of the remote WireGuard endpoint (the remote endpoint is also listening on port 51820, but the above iptables rules would capture similar output even if the remote endpoint was on some other port).
You can also use iptables to log the packets that are sent inside the WireGuard tunnel. Run the following commands to log packet headers sent through the tunnel to and from the system itself (where wg0 is the name of your WireGuard interface):
# iptables -I INPUT -i wg0 -j LOG --log-prefix 'tunnel wireguard iptables: ' --log-level 7
# iptables -I OUTPUT -o wg0 -j LOG --log-prefix 'tunnel wireguard iptables: ' --log-level 7
And run the following commands to log packer headers sent through the tunnel to and from other hosts (if the system is operating as a router for other hosts on its network):
# iptables -I FORWARD -i wg0 -j LOG --log-prefix 'tunnel wireguard iptables: ' --log-level 7
# iptables -I FORWARD -o wg0 -j LOG --log-prefix 'tunnel wireguard iptables: ' --log-level 7
This will allow you to track exactly what is being sent through your WireGuard virtual private network. The short HTTP request and response from above will look like this when logging the packets within the tunnel:
[Sat Mar  6 20:45:15 2021] tunnel wireguard iptables: IN=wg0 OUT= MAC= SRC=10.0.0.2 DST=10.0.0.1 LEN=60 TOS=0x00 PREC=0x00 TTL=64 ID=25937 DF PROTO=TCP SPT=34770 DPT=8080 WINDOW=62167 RES=0x00 SYN URGP=0
[Sat Mar  6 20:45:15 2021] tunnel wireguard iptables: IN= OUT=wg0 SRC=10.0.0.1 DST=10.0.0.2 LEN=60 TOS=0x00 PREC=0x00 TTL=64 ID=0 DF PROTO=TCP SPT=8080 DPT=34770 WINDOW=62083 RES=0x00 ACK SYN URGP=0
[Sat Mar  6 20:45:15 2021] tunnel wireguard iptables: IN=wg0 OUT= MAC= SRC=10.0.0.2 DST=10.0.0.1 LEN=52 TOS=0x00 PREC=0x00 TTL=64 ID=25938 DF PROTO=TCP SPT=34770 DPT=8080 WINDOW=972 RES=0x00 ACK URGP=0
[Sat Mar  6 20:45:15 2021] tunnel wireguard iptables: IN=wg0 OUT= MAC= SRC=10.0.0.2 DST=10.0.0.1 LEN=129 TOS=0x00 PREC=0x00 TTL=64 ID=25939 DF PROTO=TCP SPT=34770 DPT=8080 WINDOW=972 RES=0x00 ACK PSH URGP=0
[Sat Mar  6 20:45:15 2021] tunnel wireguard iptables: IN= OUT=wg0 SRC=10.0.0.1 DST=10.0.0.2 LEN=52 TOS=0x00 PREC=0x00 TTL=64 ID=2583 DF PROTO=TCP SPT=8080 DPT=34770 WINDOW=969 RES=0x00 ACK URGP=0
[Sat Mar  6 20:45:15 2021] tunnel wireguard iptables: IN= OUT=wg0 SRC=10.0.0.1 DST=10.0.0.2 LEN=206 TOS=0x00 PREC=0x00 TTL=64 ID=2584 DF PROTO=TCP SPT=8080 DPT=34770 WINDOW=969 RES=0x00 ACK PSH URGP=0
[Sat Mar  6 20:45:15 2021] tunnel wireguard iptables: IN= OUT=wg0 SRC=10.0.0.1 DST=10.0.0.2 LEN=349 TOS=0x00 PREC=0x00 TTL=64 ID=2585 DF PROTO=TCP SPT=8080 DPT=34770 WINDOW=969 RES=0x00 ACK PSH FIN URGP=0
[Sat Mar  6 20:45:15 2021] tunnel wireguard iptables: IN=wg0 OUT= MAC= SRC=10.0.0.2 DST=10.0.0.1 LEN=52 TOS=0x00 PREC=0x00 TTL=64 ID=25940 DF PROTO=TCP SPT=34770 DPT=8080 WINDOW=970 RES=0x00 ACK URGP=0
[Sat Mar  6 20:45:15 2021] tunnel wireguard iptables: IN=wg0 OUT= MAC= SRC=10.0.0.2 DST=10.0.0.1 LEN=52 TOS=0x00 PREC=0x00 TTL=64 ID=25941 DF PROTO=TCP SPT=34770 DPT=8080 WINDOW=966 RES=0x00 ACK FIN URGP=0
[Sat Mar  6 20:45:15 2021] tunnel wireguard iptables: IN= OUT=wg0 SRC=10.0.0.1 DST=10.0.0.2 LEN=52 TOS=0x00 PREC=0x00 TTL=64 ID=2586 DF PROTO=TCP SPT=8080 DPT=34770 WINDOW=969 RES=0x00 ACK URGP=0
In the above output, the IP address of local WireGuard interface is 10.0.0.1, and the IP address of the remote WireGuard peer is 10.0.0.2. An HTTP server is running on port 8080 of the local host, which the remote host is connecting to through the WireGuard tunnel (using the ephemeral TCP port 34770 inside the tunnel).
You can use the iptables logging on UDP port 51820 (the first example) to keep track of the external IP addresses that are connecting to your WireGuard network; and the iptables logging on the wg0 interface (the last example) to track which peers are using your network (and what they’re accessing inside the network).
You can remove iptables rules by running the same command you used to add them, except replacing the -I flag (or the -A flag for appended rules) with the -D flag. For example, you can remove the last two rules added above by running the following commands:
# iptables -D FORWARD -i wg0 -j LOG --log-prefix 'tunnel wireguard iptables: ' --log-level 7
# iptables -D FORWARD -o wg0 -j LOG --log-prefix 'tunnel wireguard iptables: ' --log-level 7
To check for active rules that you may want to remove, run iptables-save (iptables-save doesn’t actually save anything, it just dumps all active rules in a format that can be saved and restored).
Pro Custodibus
If you run the Pro Custodibus agent on a host, you can use Pro Custodibus to capture and manage WireGuard logging for you. You can view WireGuard logging in the Pro Custodibus UI, or you can export it to your own analytics, SIEM, or other logging systems.
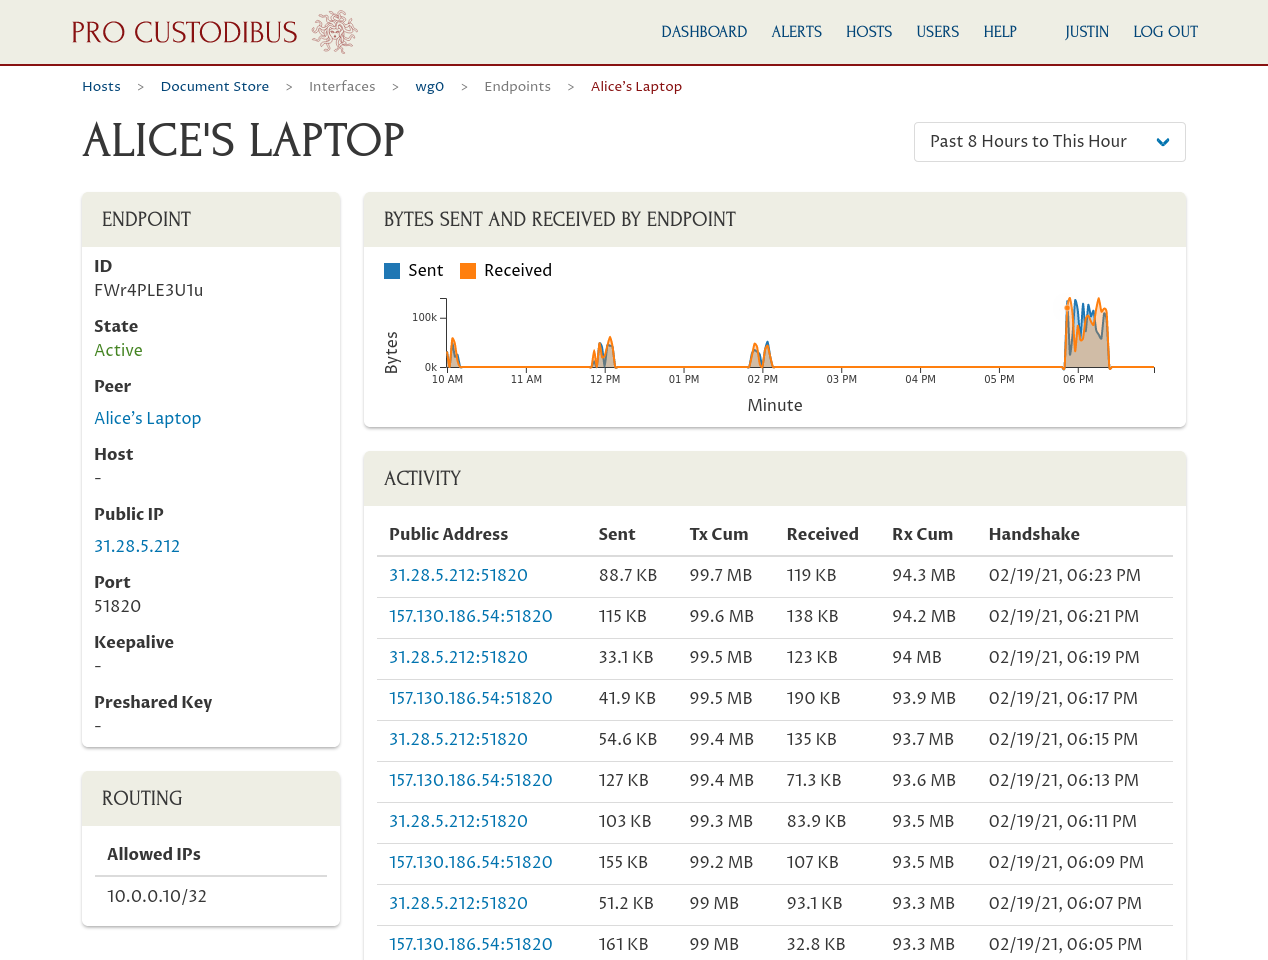
The Pro Custodibus UI will show you the record of handshakes for a particular WireGuard endpoint, as well as a running tally of bytes sent and received:
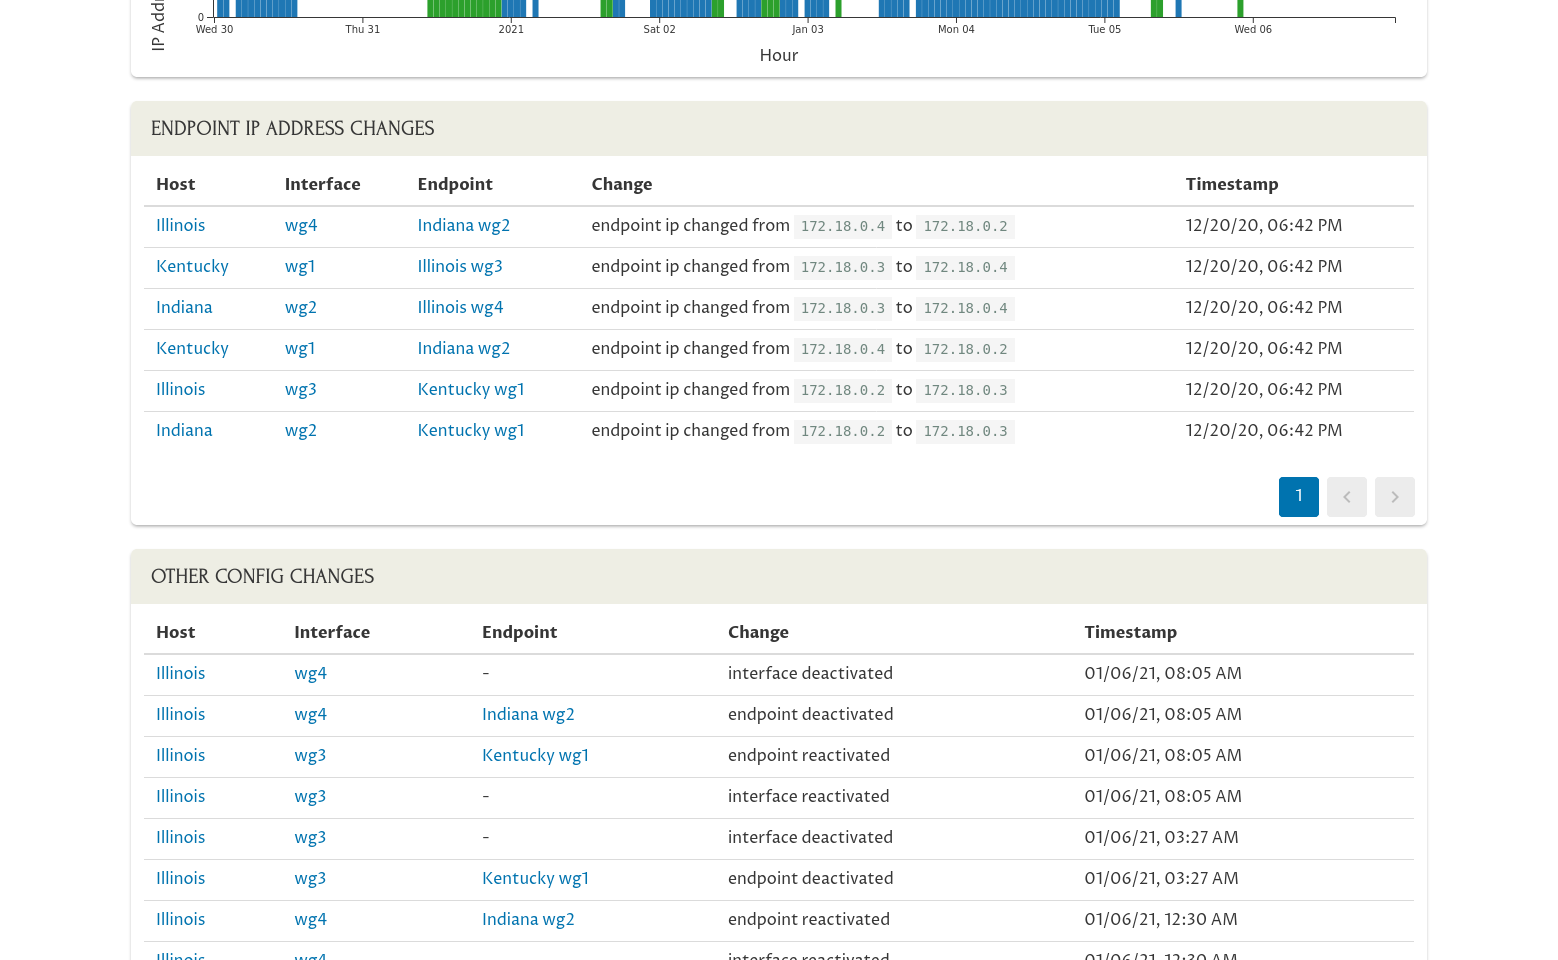
You can also use Pro Custodibus to keep track of when the IP address used by a WireGuard peer changes, and well as other WireGuard configuration changes to each monitored host:
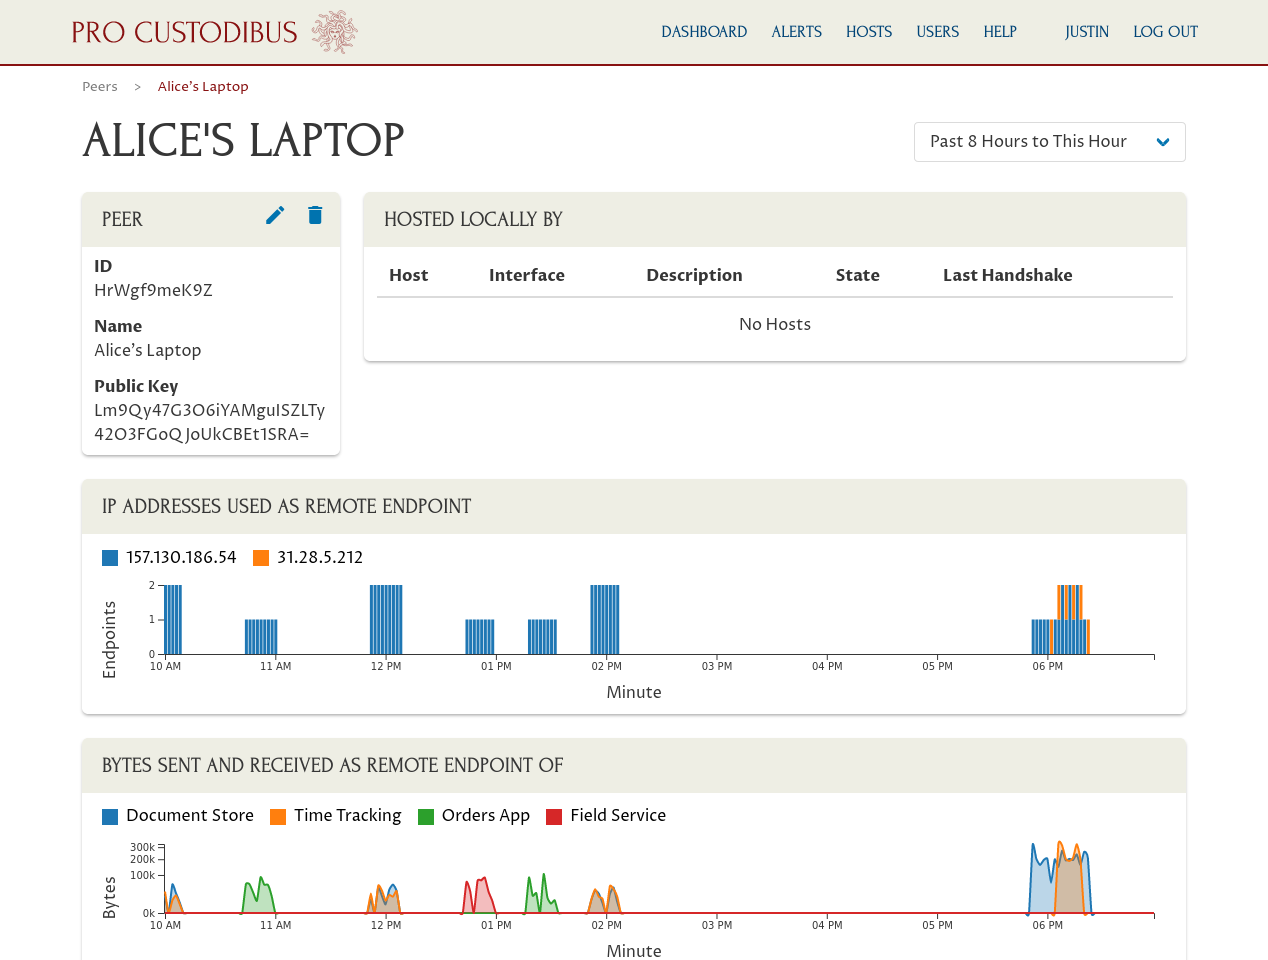
And to make all this logging usable, Pro Custodibus gives you helpful visualizations of which peers have been connecting to which other peers over time:
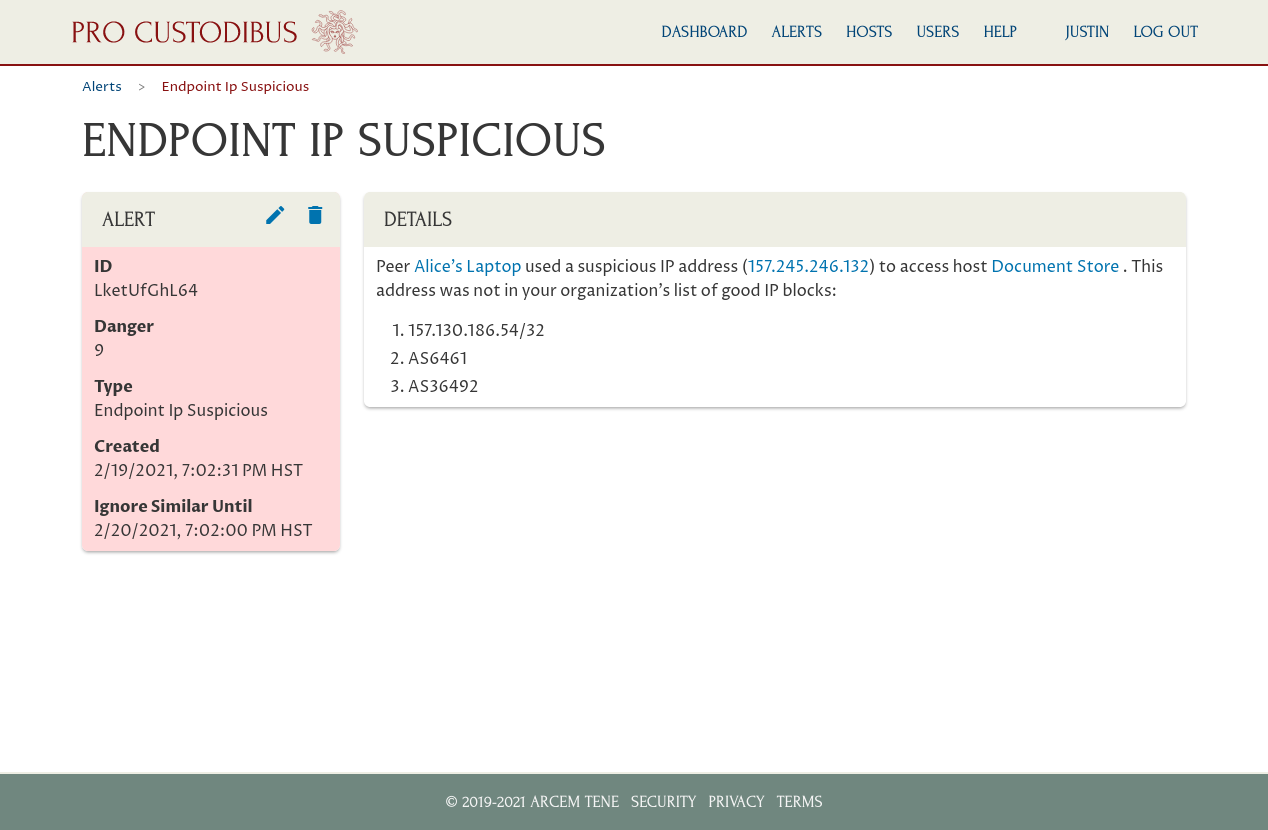
Plus Pro Custodibus has built-in alerts to notify you of sudden changes to the IP addresses used by your WireGuard peers (or of other suspicious behavior):