How to Monitor Who’s Connected to Your WireGuard VPN
A WireGuard VPN (Virtual Private Network) is really easy to set up, thanks to WireGuard making the right cryptographic choices by default, and its overall simplicity and elegance of design. This simplicity makes it really hard to monitor, however — there’s no log file you can tail to watch who’s connecting to your VPN, and no audit trail you can check to see where and when critical changes have been made.
Fortunately, there are some tools out there that can help you keep tabs on who’s been accessing your WireGuard VPN, and alert you of any suspicious activity. Here’s a survey of your options:
SSH
The simplest thing you can do is just SSH into each of the WireGuard hosts on your network, and use WireGuard’s built-in status display to check the current status of each interface and peer. This might be feasible if you have just a few primary VPN servers through which your endpoints connect (rather than a mesh of endpoints connected point-to-point).
If you SSH into a host running WireGuard, you can get a nice command-line display of each WireGuard interface that’s active on the host, as well as a list of each peer configured for the interface, via the wg command:
$ sudo wg show
interface: wg1
  public key: /TOE4TKtAqVsePRVR+5AA43HkAK5DSntkOCO7nYq5xU=
  private key: (hidden)
  listening port: 51821

peer: fE/wdxzl0klVp/IR8UcaoGUMjqaWi3jAd7KzHKFS6Ds=
  endpoint: 172.19.0.8:51822
  allowed ips: 10.0.0.2/32
  latest handshake: 1 minute, 22 seconds ago
  transfer: 3.48 MiB received, 33.46 MiB sent

peer: jUd41n3XYa3yXBzyBvWqlLhYgRef5RiBD7jwo70U+Rw=
  endpoint: 172.19.0.7:51823
  allowed ips: 10.0.0.3/32
  latest handshake: 2 hours, 3 minutes, 34 seconds ago
  transfer: 1.40 MiB received, 19.46 MiB sent
Note that wg, wg show, and wg show all produce the same output. You can also get an automatically-updating version of this if you run it with the watch command, like so (updating every 2 seconds by default):
$ sudo watch wg show
interface: wg1
  public key: /TOE4TKtAqVsePRVR+5AA43HkAK5DSntkOCO7nYq5xU=
  ...
Each peer listed will include the public key used by the peer, as well as four other fields:
- endpoint
-
Current public IP address (and UDP port) used by the peer. This is updated from the originally-configured value of the peer whenever the local interface receives a new packet from the peer with a different source address (or port).
- allowed ips
-
IP addresses the local WireGuard interface will route to the peer.
- latest handshake
-
If the local interface has successfully connected to the remote peer since the interface was started, this indicates the last time the connection was re-keyed. The re-keying “handshake” occurs every 2-3 minutes when the connection is actively used (and only when used), so it gives you a good approximation of the last time the connection was active. This field will be omitted if the interface hasn’t successfully connected to the peer since the interface was started.
- transfer
-
If the local interface has attempted to connect to the remote peer since the interface was started, this indicates how much data was received from and sent to the peer. This field will be omitted if the interface hasn’t attempted to connect to the peer since the interface was started.
The obvious downsides to using this as your sole monitoring tool is that you have to keep an SSH session open to each host you want to monitor, and you can only see what’s happening right now (or the last time each peer was active) — and not what happened at the specific times you may want to investigate or analyze.
Run a Web Server
Another option (especially if you only have a few hosts you want to monitor) is to run a web application on each WireGuard host you want to monitor. There are several open-source applications that you can download and run that will provide a nice, friendly GUI (Graphical User Interface) to display the status of WireGuard on the host on which it’s running, giving you a web-based analogue to the command-line wg tool.
While several previously popular GUIs, such as wg-dashboard, are no longer actively maintained, one nifty project that still is active is Wg Gen Web. In addition to allowing you to configure a WireGuard interface and its peers via web UI, Wg Gen Web also provides a status page that shows the current status of the VPN connections to that interface:
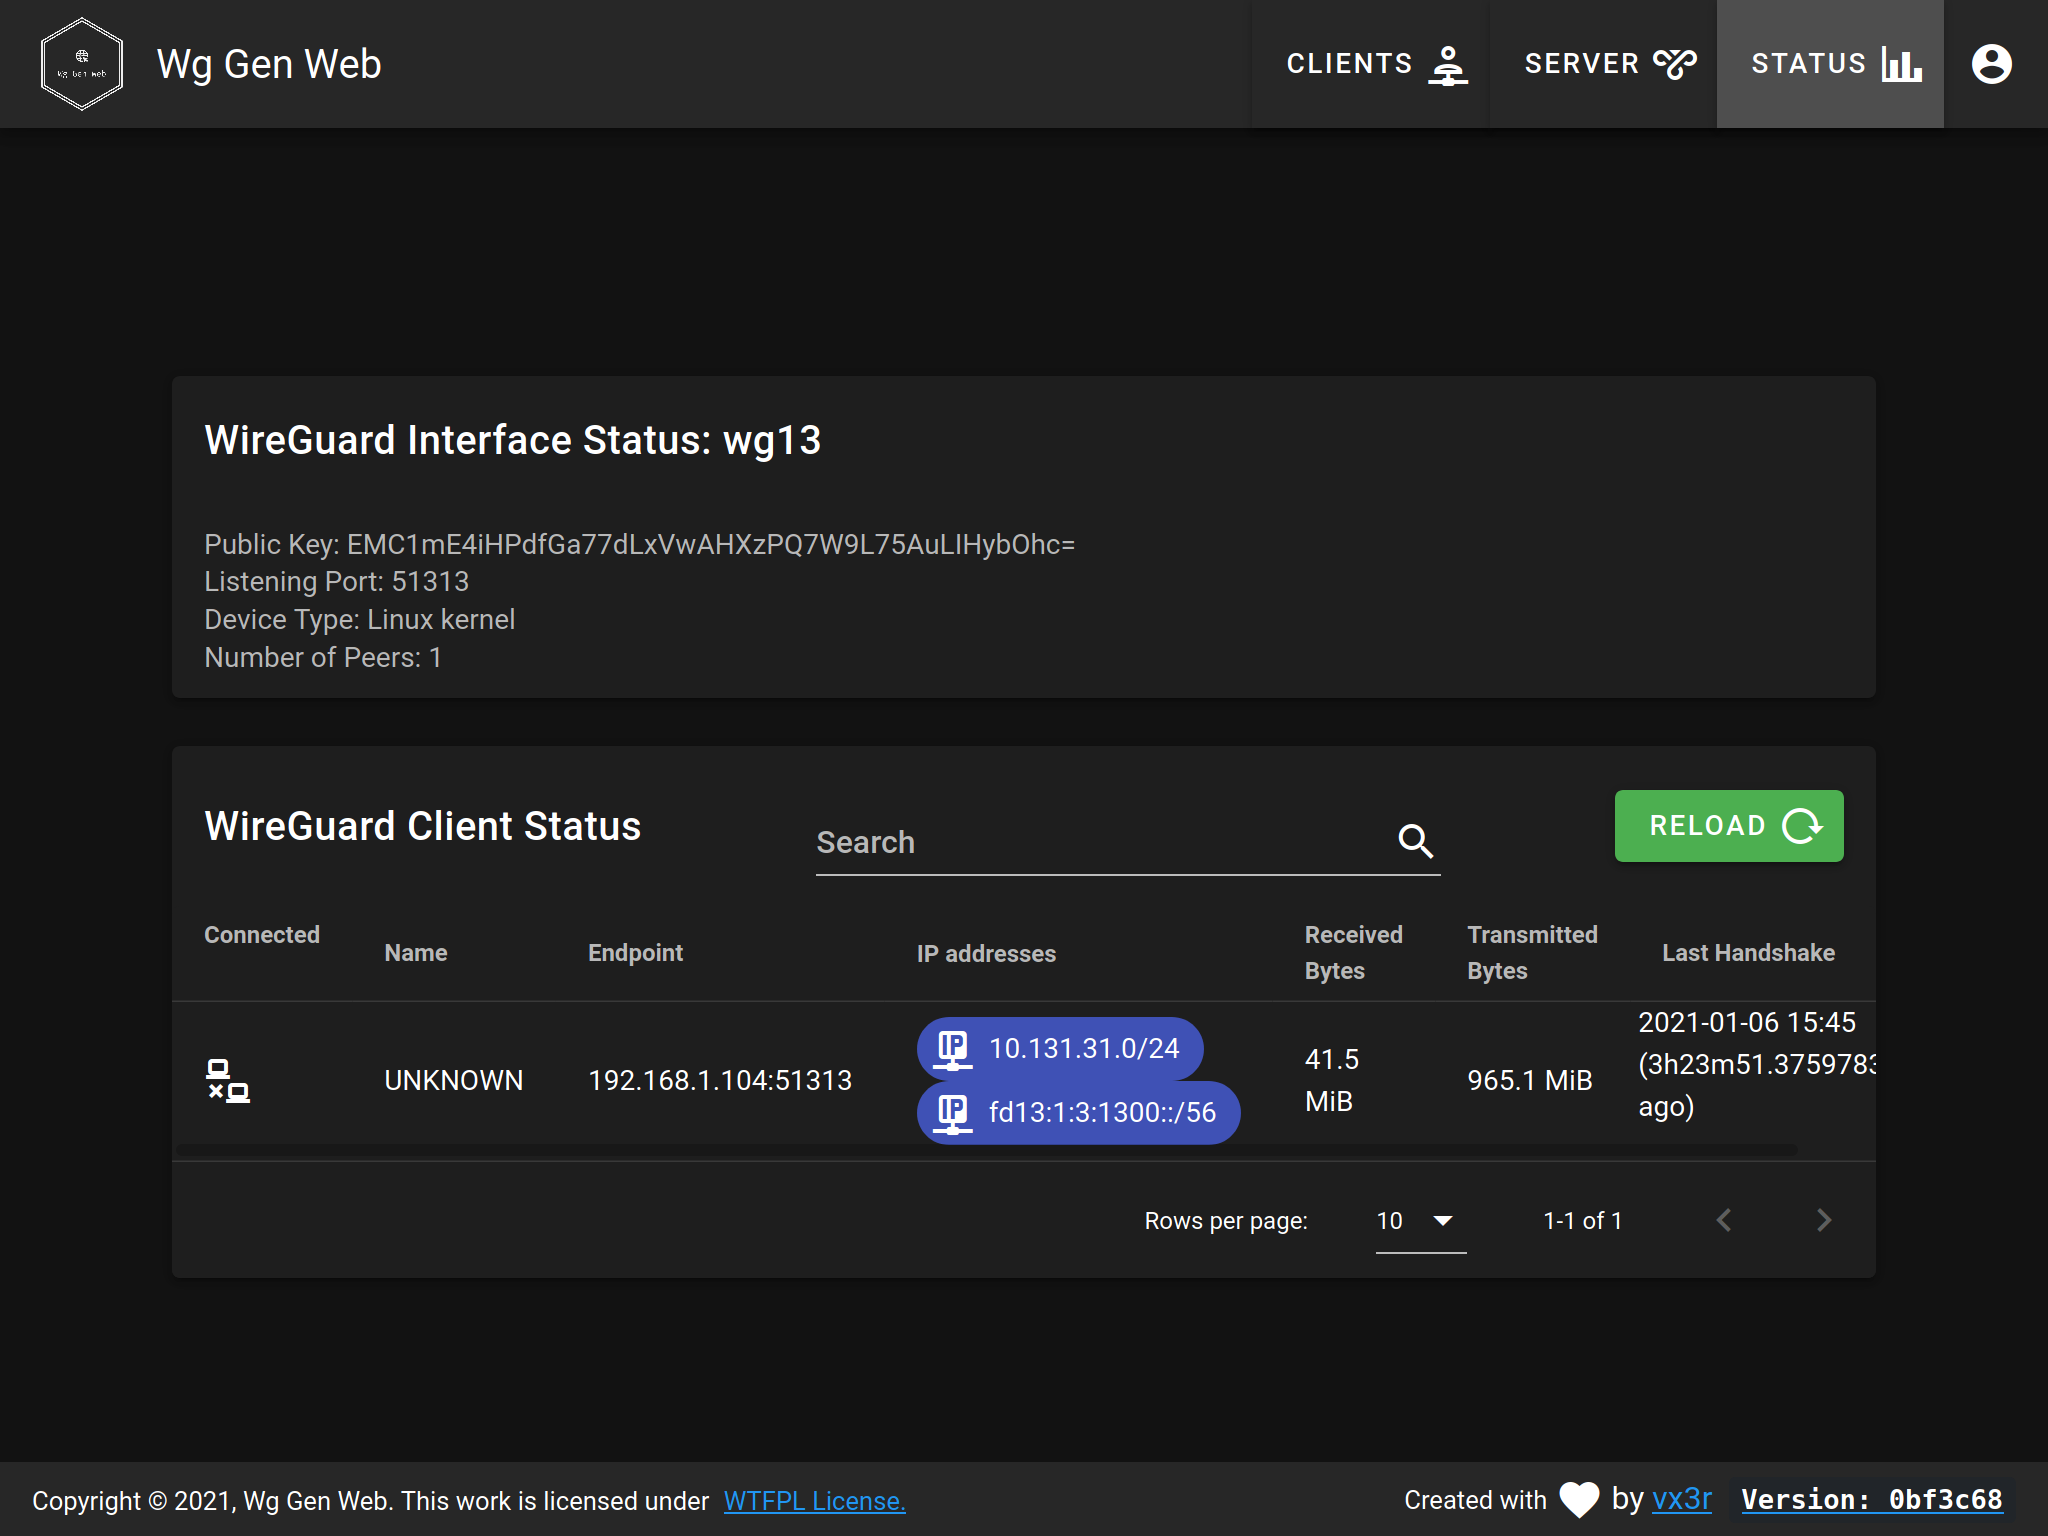
Wg Gen Web is implemented with a Golang HTTP server as its “backend”, and a Vue.js web UI for its “frontend”; both parts are served by the “backend” HTTP server. It also relies on a second Golang HTTP server (from the WG-API project) to expose status data from the host.
The simplest way to use this would be to run a couple of Docker containers on each WireGuard host you want to monitor (one Docker container for the main HTTP server, and one for the status server). The Wg Gen Web project’s README includes an example docker-compose.yml file to demonstrate how to do this:
version: '2.0'
services:
  wg-gen-web:
    image: vx3r/wg-gen-web:latest
    container_name: wg-gen-web
    restart: unless-stopped
    ports:
      - "8080:8080"
    environment:
      - WG_CONF_DIR=/data
      - WG_INTERFACE_NAME=wg0.conf
      - SMTP_HOST=smtp.gmail.com
      - SMTP_PORT=587
      - SMTP_USERNAME=example@gmail.com
      - SMTP_PASSWORD=****************
      - SMTP_FROM=Example <example@gmail.com>
      - OAUTH2_PROVIDER_NAME=github
      - OAUTH2_PROVIDER=https://github.com
      - OAUTH2_CLIENT_ID=******************
      - OAUTH2_CLIENT_SECRET=******************
      - OAUTH2_REDIRECT_URL=https://wg-gen-web.example.com
      - WG_STATS_API=$BRIDGE_GATEWAY_ADDRESS:8182
    volumes:
      - /etc/wireguard:/data
  wg-api:
    image: james/wg-api:latest
    container_name: wg-json-api
    restart: unless-stopped
    cap_add:
      - NET_ADMIN
    network_mode: "host"
    command: wg-api --device=wg0 --listen=$BRIDGE_GATEWAY_ADDRESS:8182
With those Docker containers up and running, you could then open up a web browser and access the Wg Gen Web status page at http://10.0.0.1:8080/status (if the IP address of the host is 10.0.0.1).
Obviously, you’d want to lock down access to this status page pretty thoroughly. And for a lot of people, running a pair of extra web servers on a VPN peer would be a two too many web servers.
Also, like with using the command-line wg tool, this status display includes only the current state of a single host, with no information from past activity available (and no information about peers not connected to this one particular host).
Build Your Own Analytics
A more sophisticated approach, and more useful if your VPN includes a number of peers, would be to build yourself a tool that periodically checks the status of each WireGuard peer, and ships that info off to a centralized location. At this centralized location, which ideally would be your existing logging, analytics, or SIEM (Security Information and Event Management) system, you’d process this status information into a chain of audit records, dashboards showing trends and significant events, and alerts for issues you need your analysts to look at and respond to.
To start off, you’d need to write a client program to run on each host that you want to monitor, periodically checking the status of the WireGuard interface(s) on that host. The wg show all dump command provides a simple way to get the same status info as provided by the regular wg command, but in tab-delimited format:
$ sudo wg show all dump
wg1	AAAAAAAAAAAAAAAAAAAAAAAAAAAAAAAAAAAAAAAAAEE=	/TOE4TKtAqVsePRVR+5AA43HkAK5DSntkOCO7nYq5xU=	51821	off
wg1	fE/wdxzl0klVp/IR8UcaoGUMjqaWi3jAd7KzHKFS6Ds=	(none)	172.19.0.8:51822	10.0.0.2/32	1617235493	3481633	33460136	off
wg1	jUd41n3XYa3yXBzyBvWqlLhYgRef5RiBD7jwo70U+Rw=	(none)	172.19.0.7:51823	10.0.0.3/32	1609974495	1403752	19462368	off
There’s also a wg-json script in the wireguard-tools repository that will convert the output of this command into JSON (JavaScript Object Notation):
$ sudo wireguard-tools/contrib/json/wg-json
{
   "wg1": {
      "privateKey": "AAAAAAAAAAAAAAAAAAAAAAAAAAAAAAAAAAAAAAAAAEE=",
      "publicKey": "/TOE4TKtAqVsePRVR+5AA43HkAK5DSntkOCO7nYq5xU=",
      "listenPort": 51821,
      "peers": {
         "fE/wdxzl0klVp/IR8UcaoGUMjqaWi3jAd7KzHKFS6Ds=": {
            "endpoint": "172.19.0.8:51822",
            "latestHandshake": 1617235493,
            "transferRx": 3481633,
            "transferTx": 33460136,
            "allowedIps": [
               "10.0.0.2/32"
            ]
         },
         "jUd41n3XYa3yXBzyBvWqlLhYgRef5RiBD7jwo70U+Rw=": {
            "endpoint": "172.19.0.7:51823",
            "latestHandshake": 1609974495,
            "transferRx": 1403752,
            "transferTx": 19462368,
            "allowedIps": [
               "10.0.0.3/32"
            ]
         }
      }
   }
}
Logging/analytics/SIEM systems are usually pretty good at ingesting tab-separated values or JSON, so you’d probably have your client program ship the output of one of the above commands to your system every so often (every two minutes aligns nicely with the re-keying “handshake” of the WireGuard protocol). You’d set up a pipeline in your logging/analytics/SIEM system to marshal this output into structured records tracked by the system. Once those records start coming in, you’d use your logging/analytics/SIEM system’s tools to start building reports, dashboards, and alerts based on that data.
That would be the start of a powerful solution — but it would take a lot of resources, domain knowledge, and coordination to implement.
Pro Custodibus
Fortunately, there’s an easy way to do this. Pro Custodibus offers a service that’s simple to set up (as simple as SSHing into a host and running a few commands), provides you with lots of pretty dashboards (with charts and graphs and integrated searching through the full history of all your WireGuard peers), but with all the functionality and scalability of a custom analytics solution.
With Pro Custodibus, you only have to run a few simple commands on a host to install an agent (or have your configuration-management tool do it automatically), and the agent will periodically ping the Pro Custodibus servers with status data from the host. The agent only ever initiates outbound connections, so you never have to worry about securing any additional inbound access to your servers or endpoints.
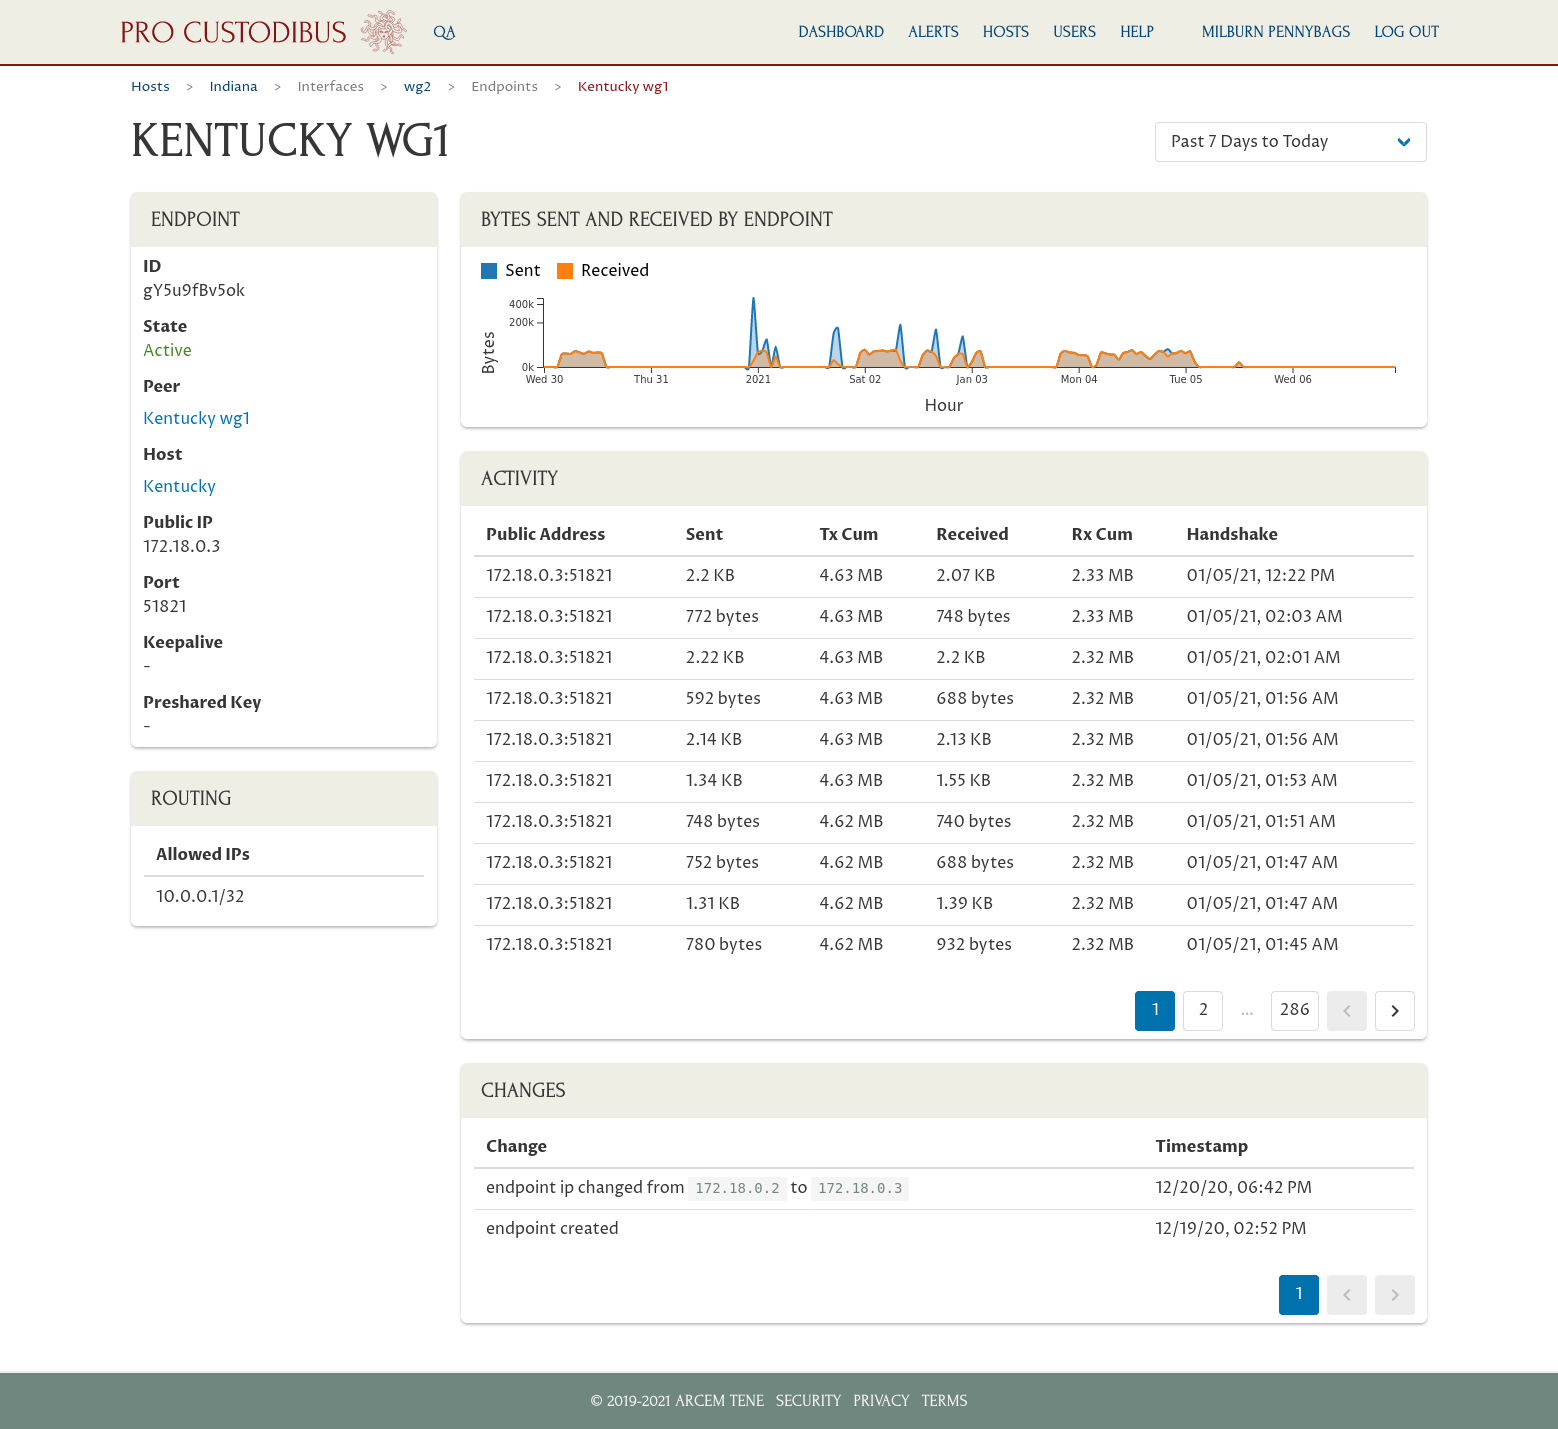
You can view the full audit trail of all WireGuard activity and configuration changes from all your hosts, on demand, through the Pro Custodibus web app (hosted in Pro Custodibus’ secure cloud datacenters):
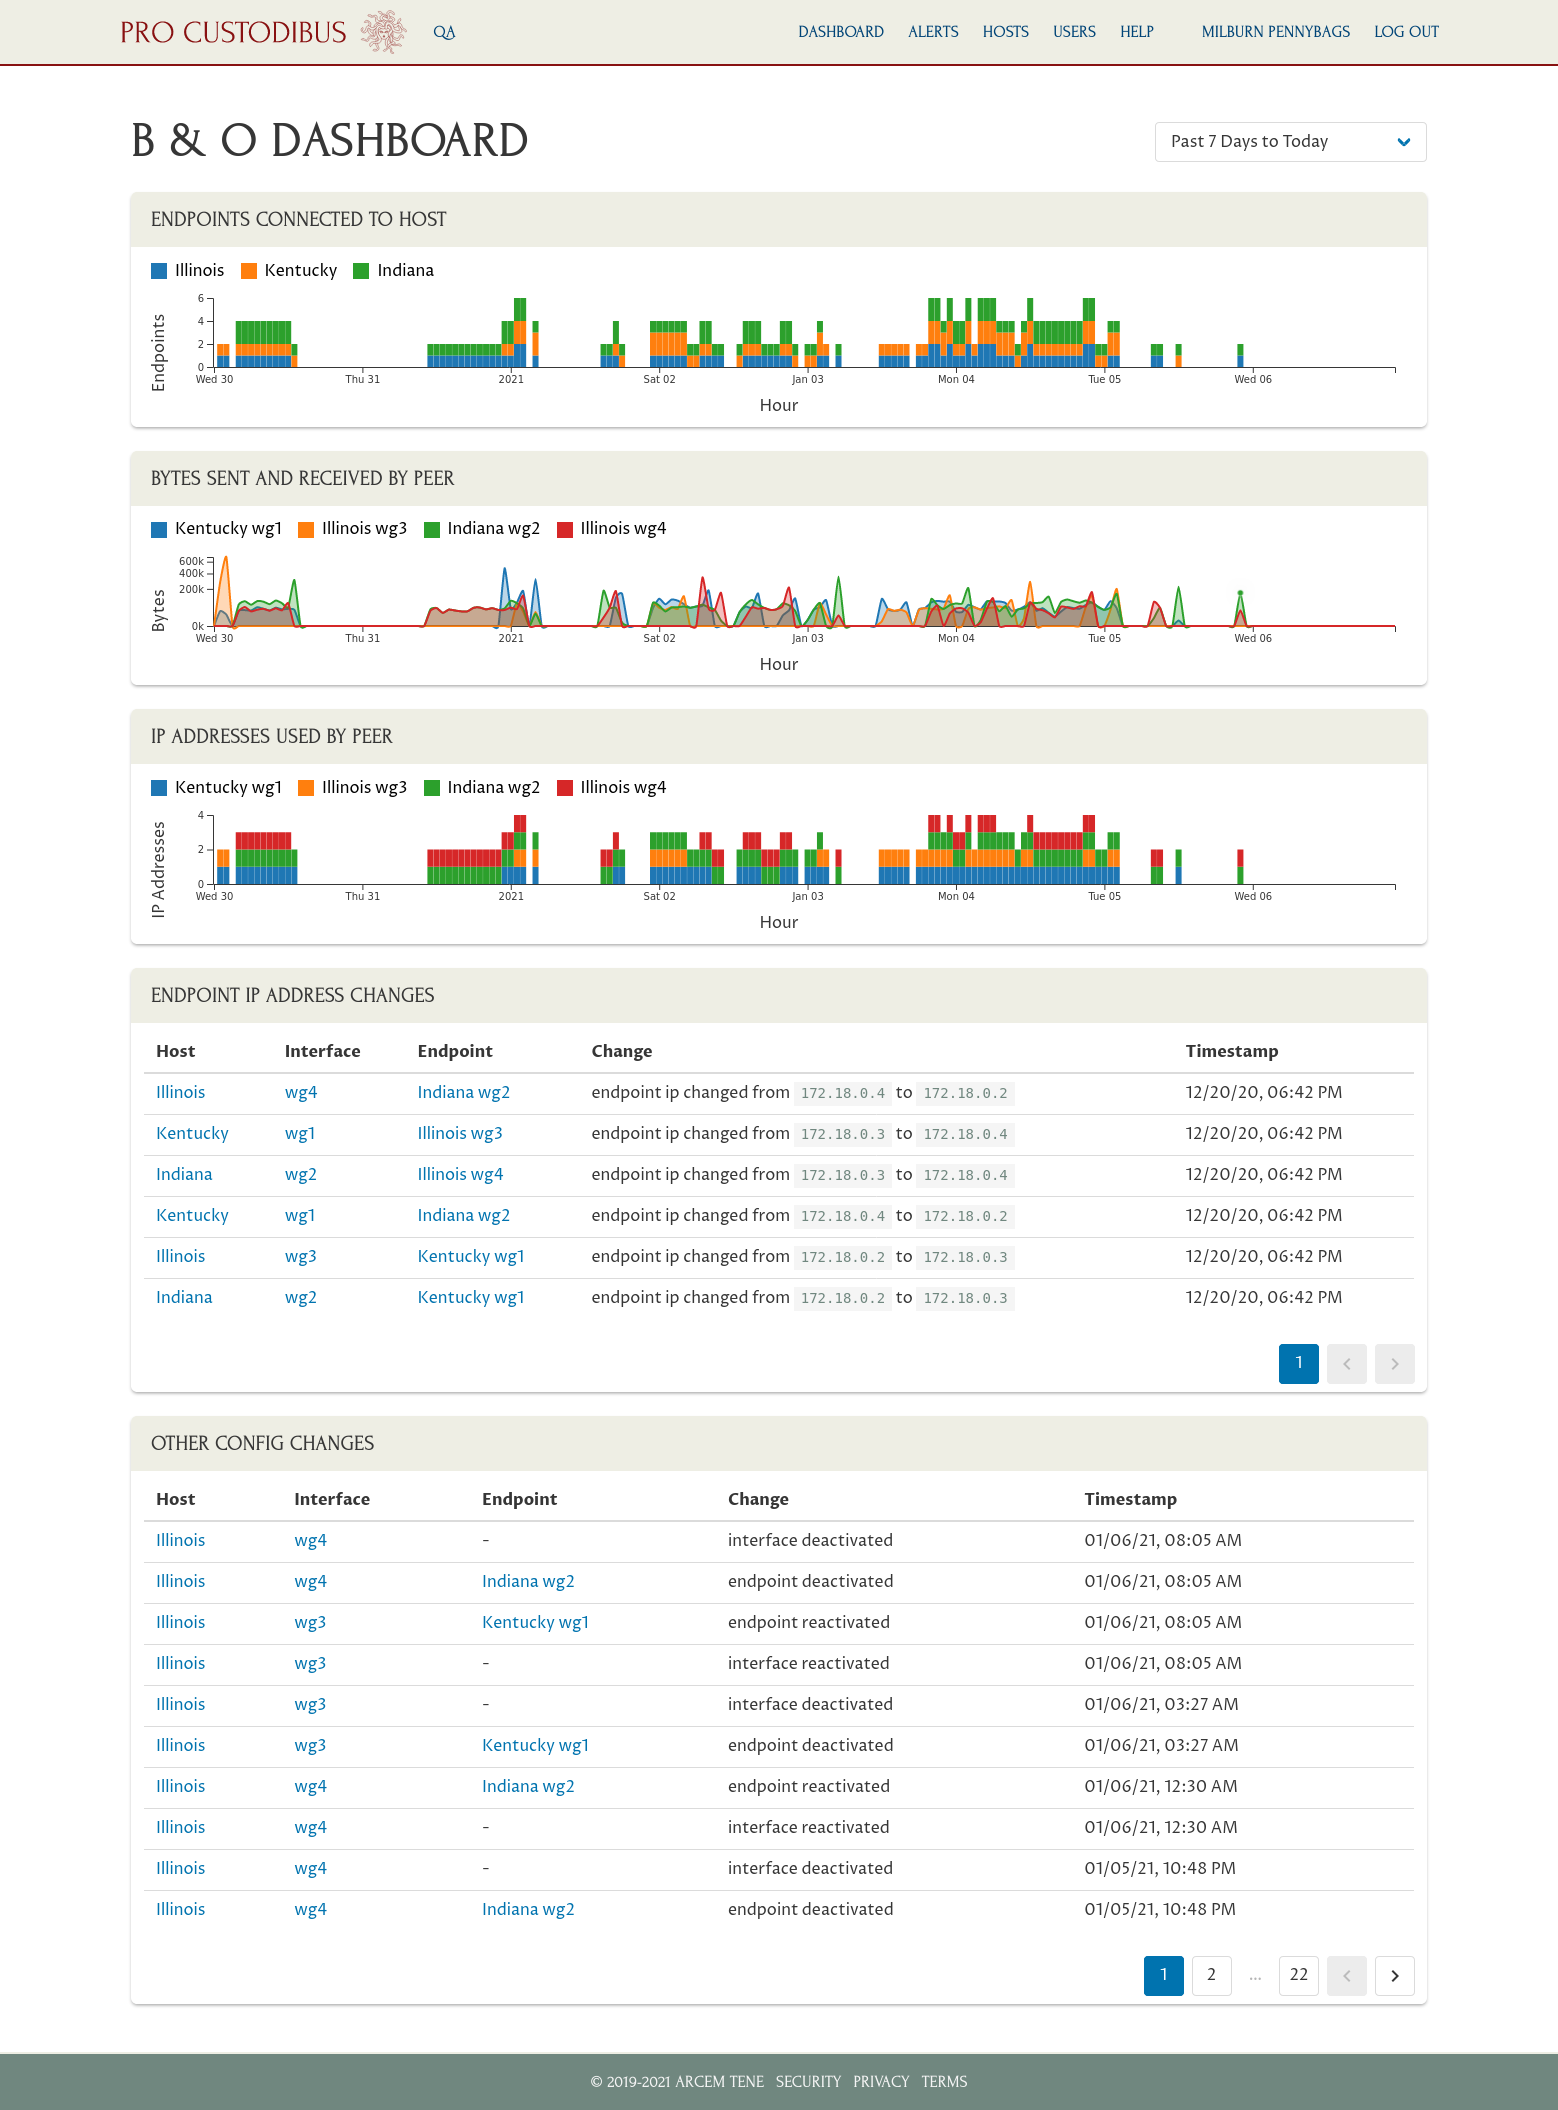
Plus you get lots of other dashboards and alerts, tuned to show you critical information about your network, like which hosts and peers have been active, and from where:
This rich monitoring data allows you to finally answer important questions about how your VPN is being used, like:
-
When was the last time Alice accessed our database cluster? (check the timestamps on the activity log of her peer’s page)
-
Who downloaded a bunch of files from our secure file share over the weekend? (check the charts on the file-share peer’s page to see which peers connected to it and received lots of data over the weekend)
-
Have the VPN credentials on Bob’s laptop been stolen and illicitly used? (check the change log on his peer’s page for IP addresses other than his home or corporate offices)
Pros
-
Full history
-
Full audit trail
-
Easy to install on servers and endpoints
-
Fully automated
-
Friendly UI
-
Can integrate into your existing analytics or SIEM systems
-
Built-in smart alerting
-
Designed with WireGuard expertise, tuned for WireGuard best practices
Cons
-
Not free (pricing here)